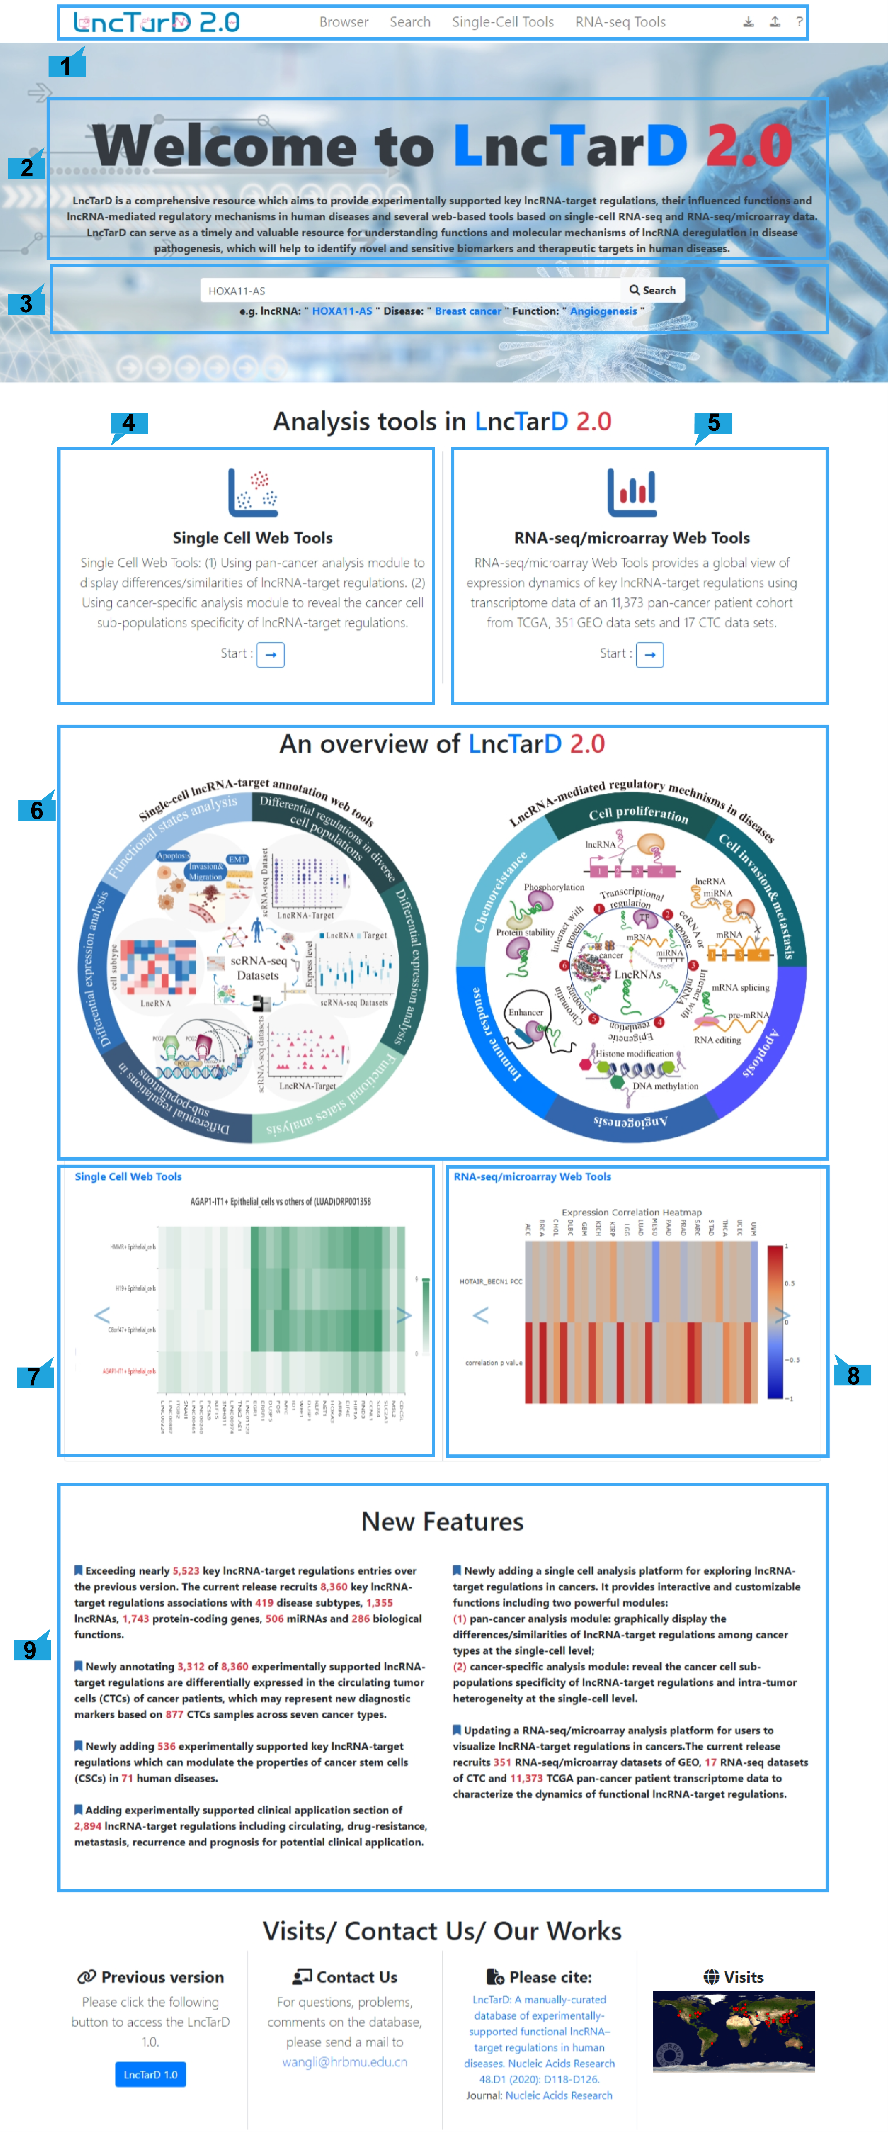
Introduction
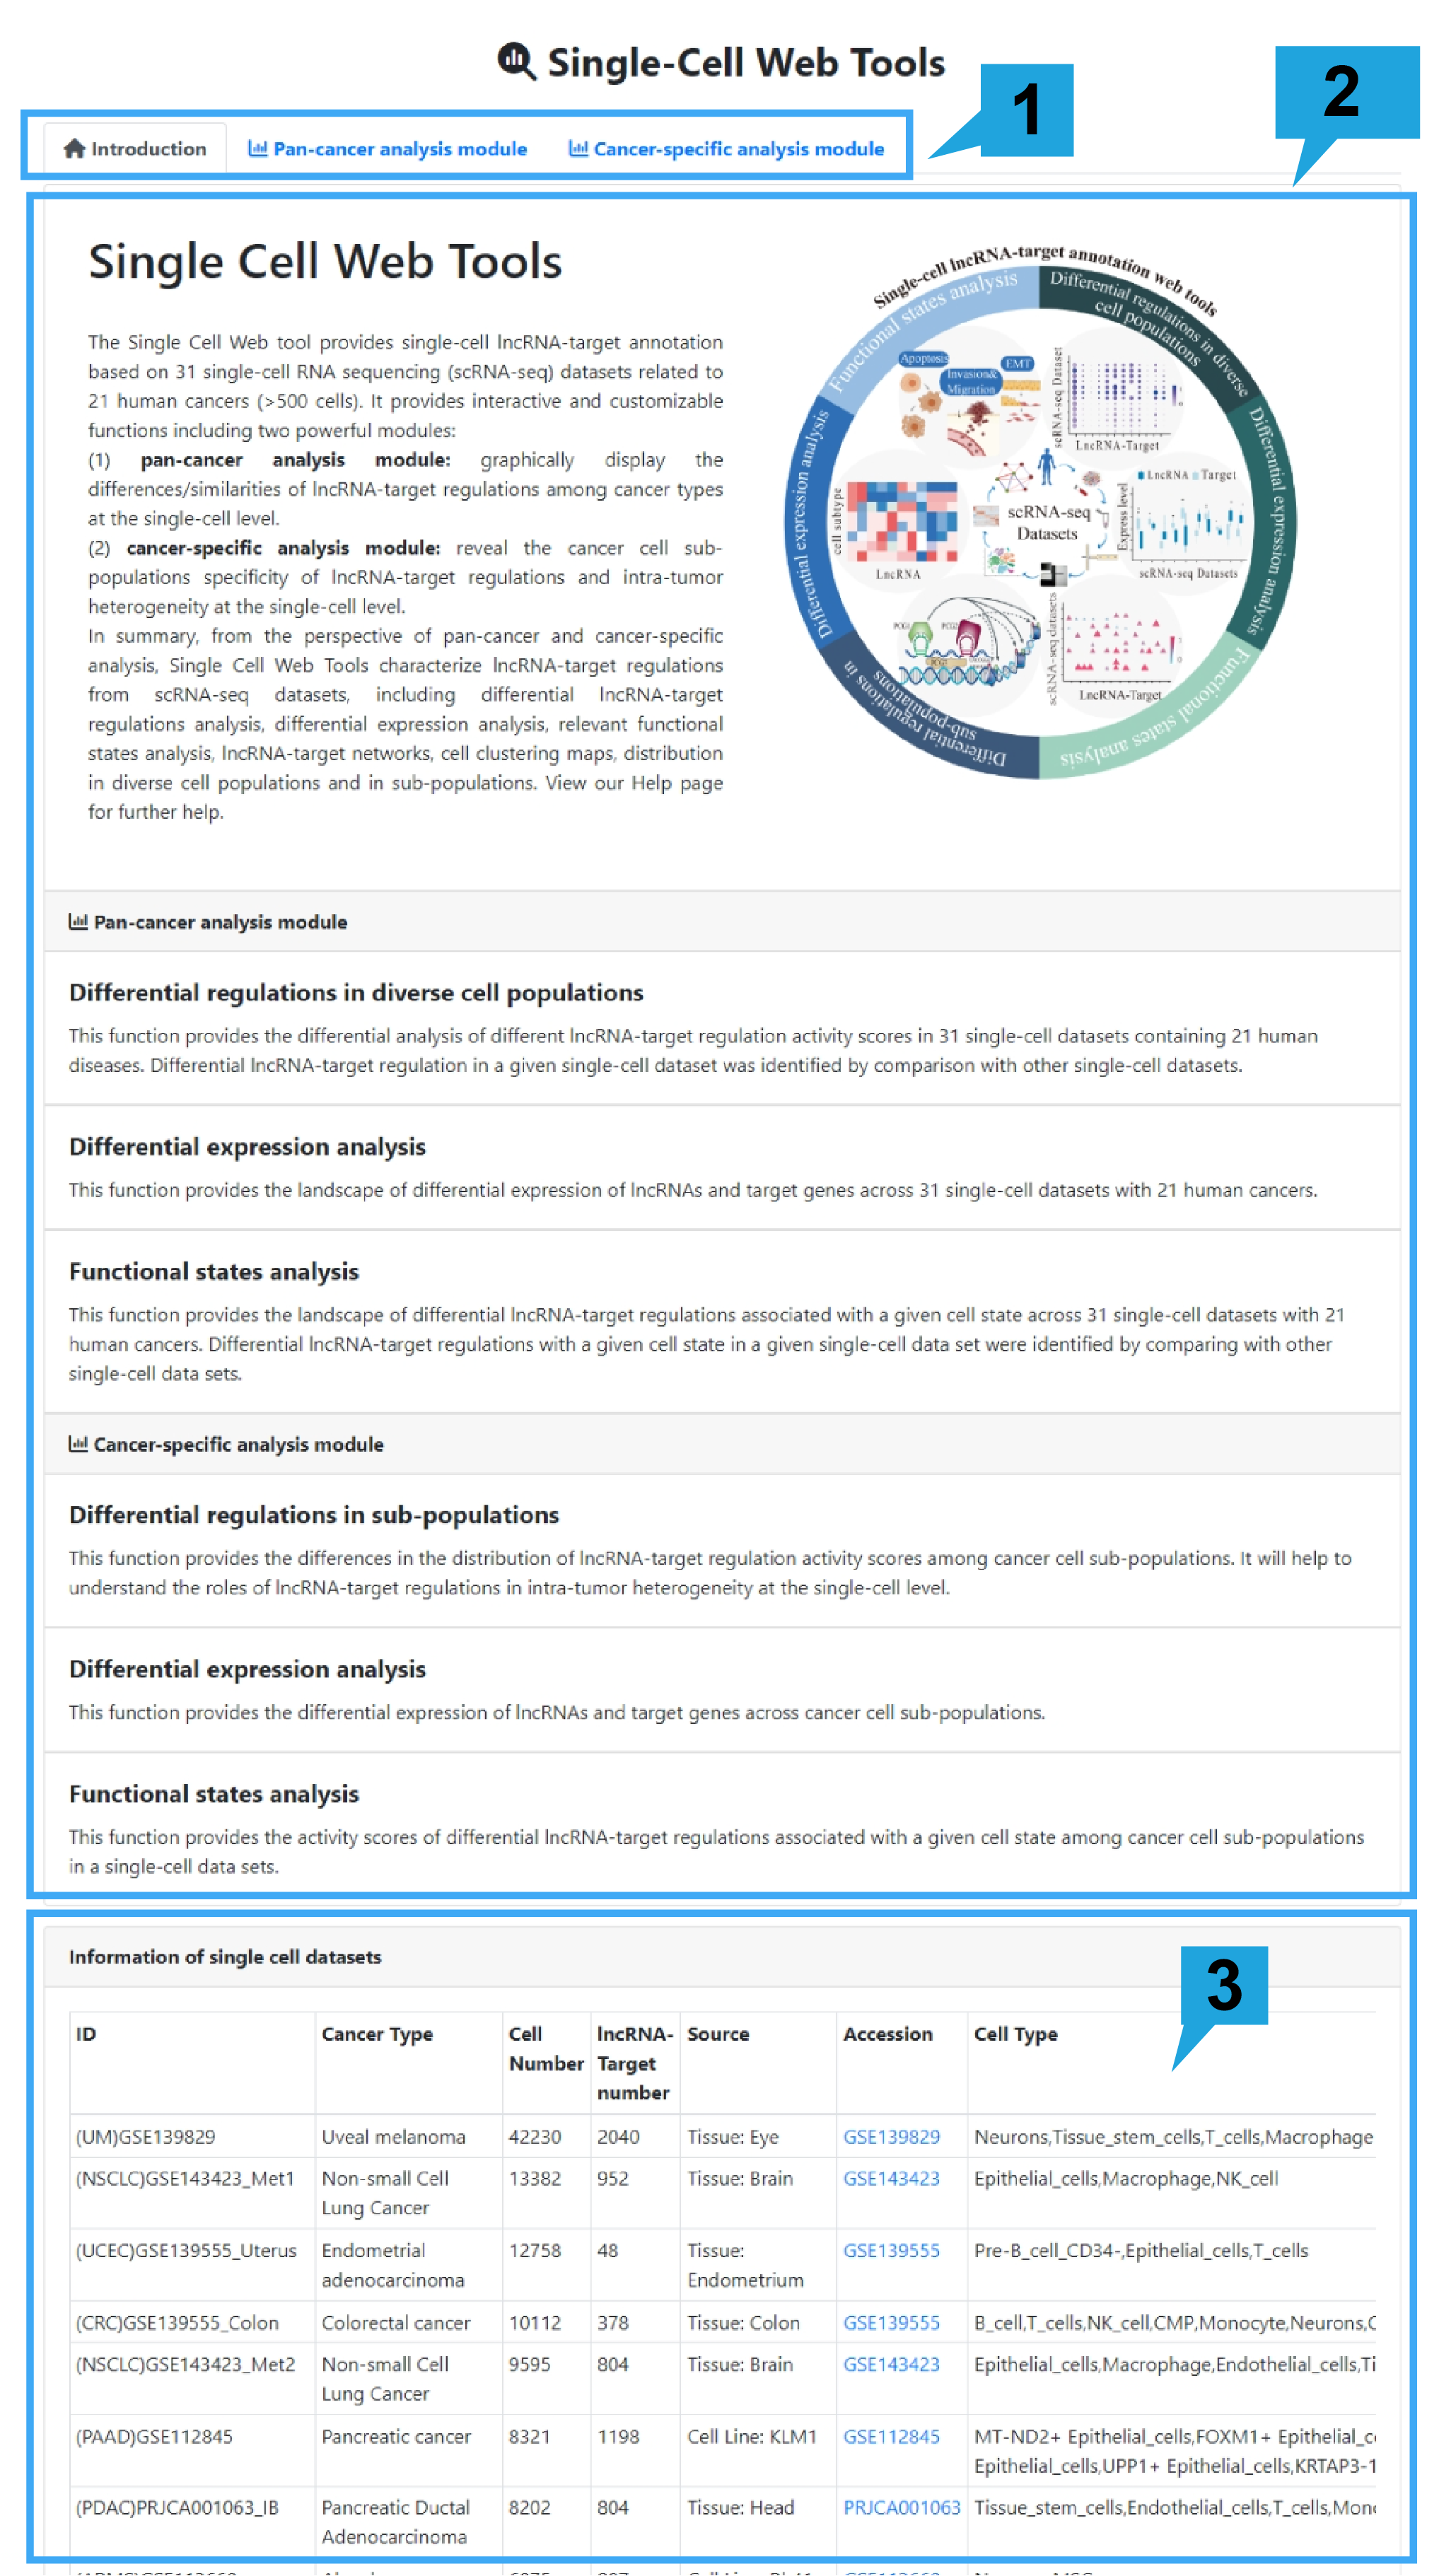
Detailed information of the Single Cell Web Tools contained complex functions for mining
single cell datasets is displayed:
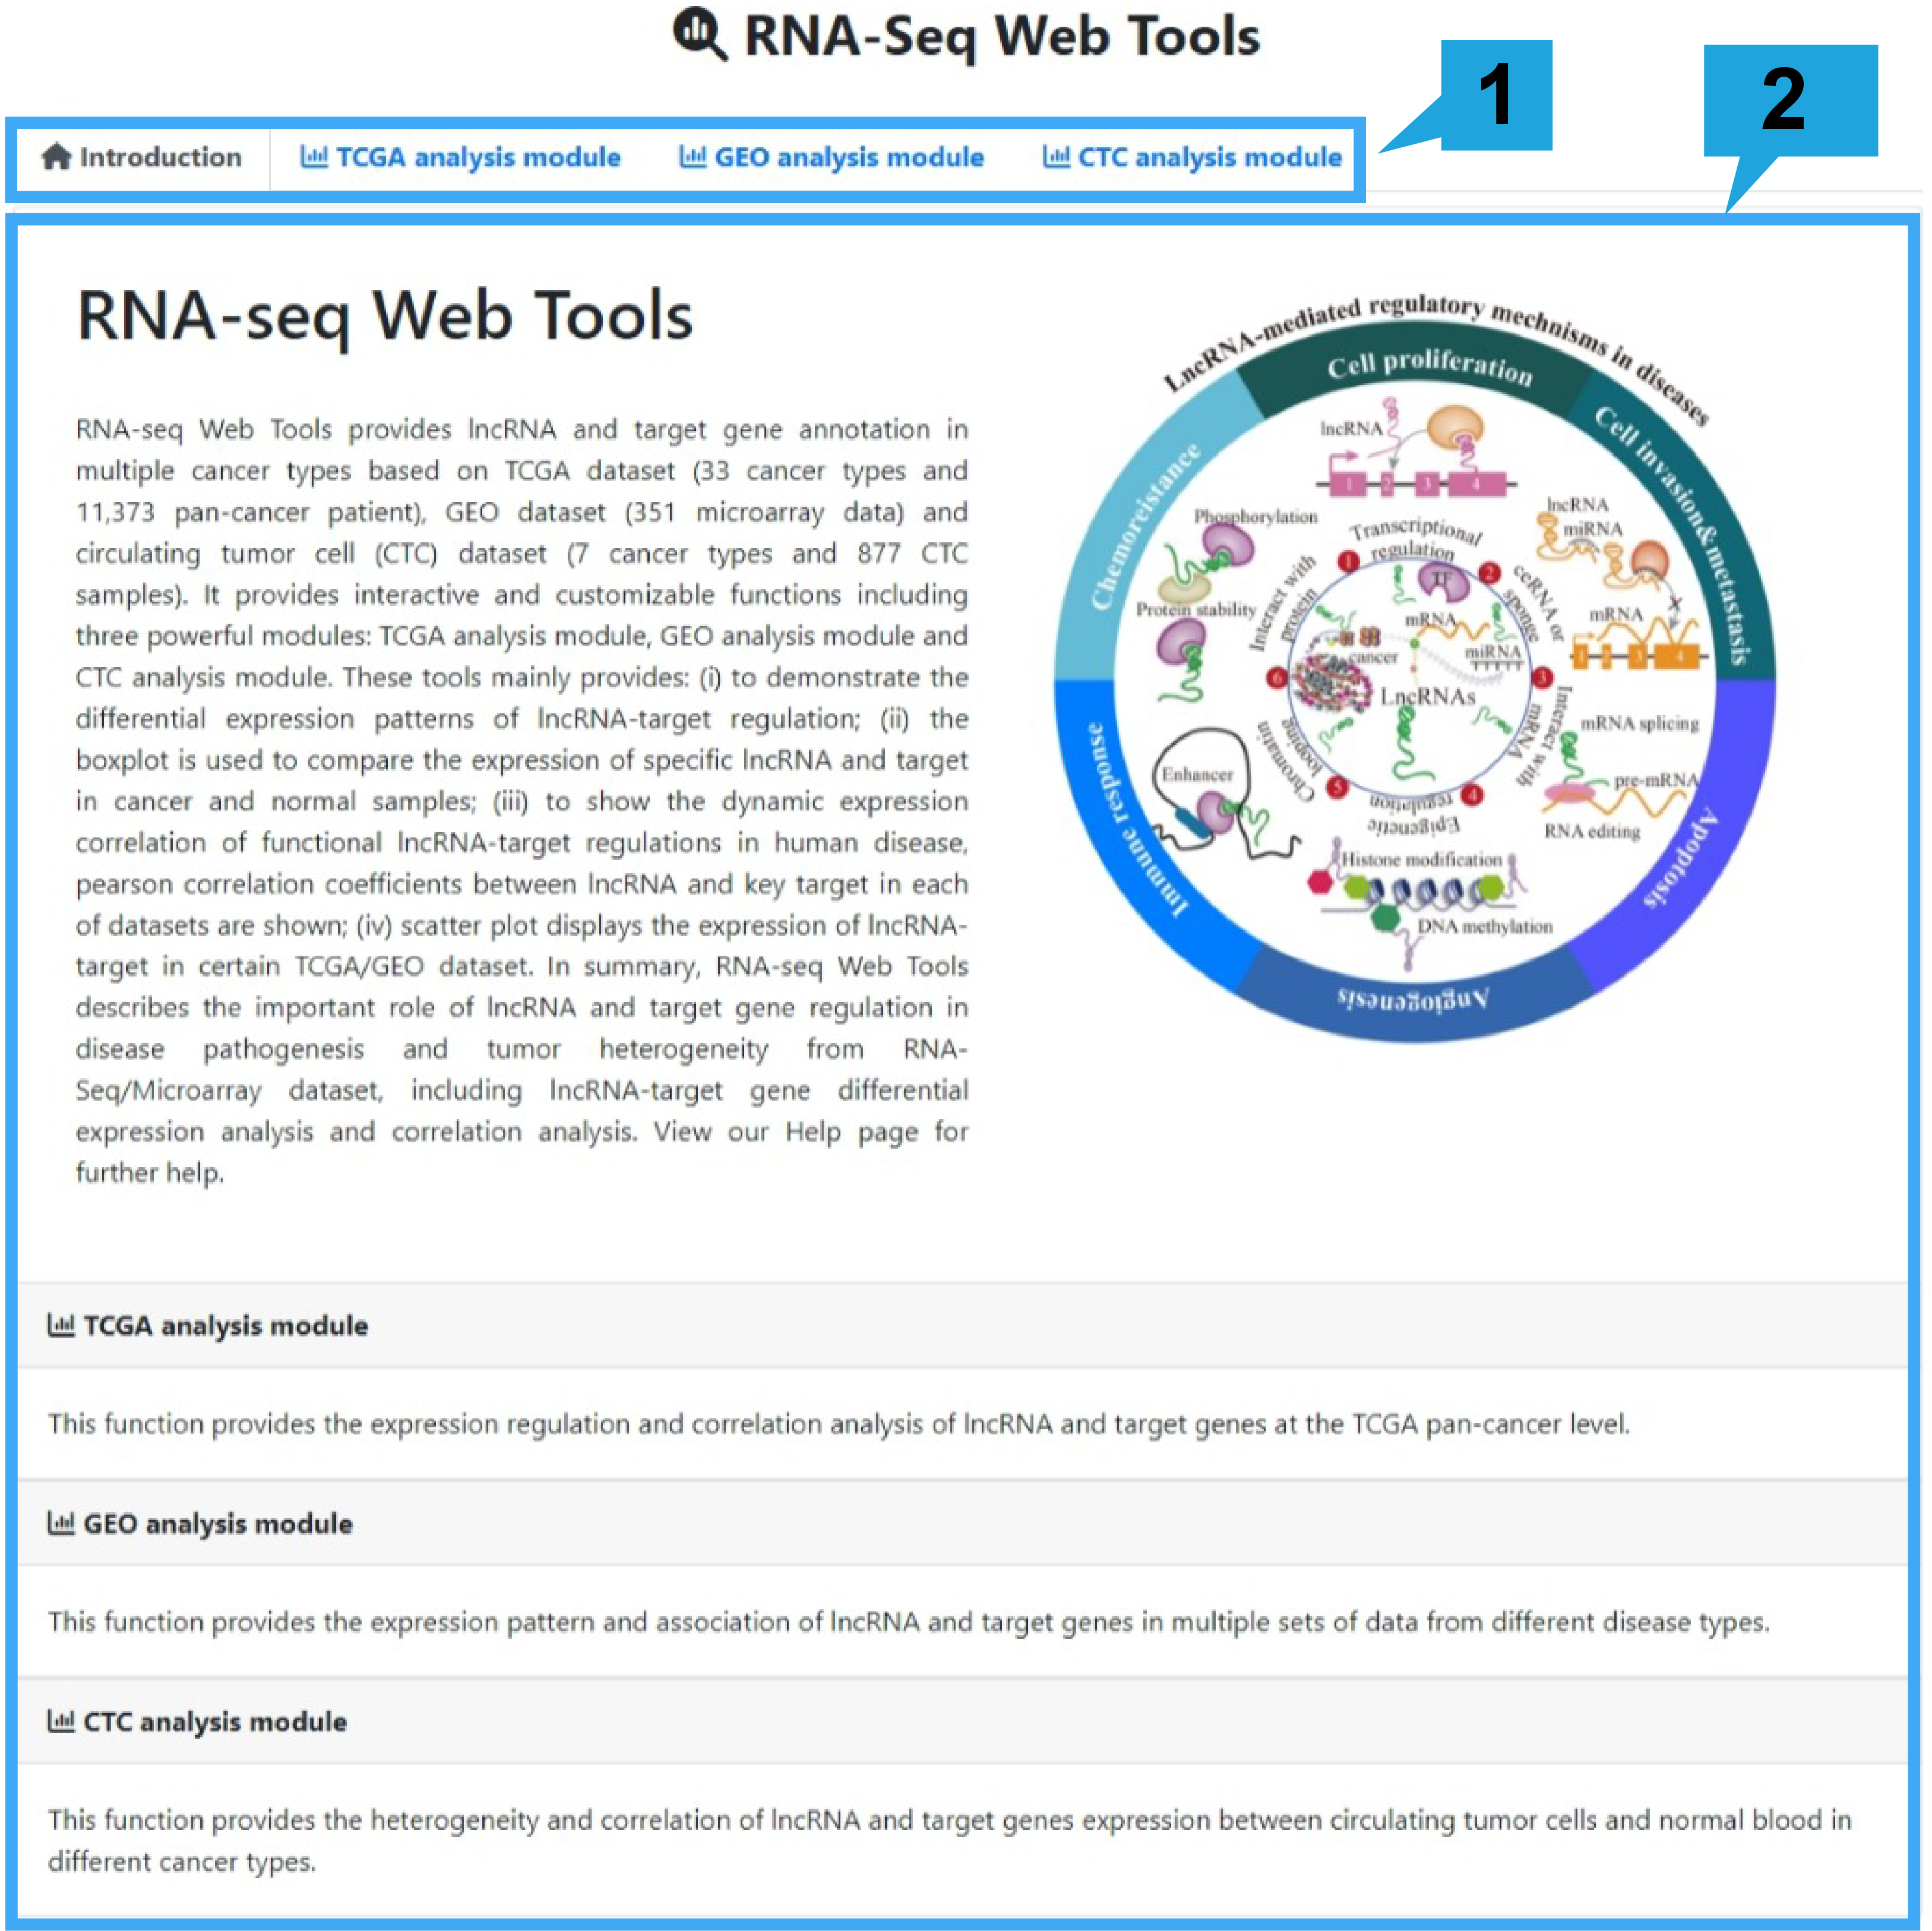
1. Main functions of the Single Cell Web Tools are provided in menu bar form (boxed in
blue).
2. Detailed introduction of main functions of Single Cell Web Tools.
3. Detailed information of single cell datasets.
Pan-cancer analysis module of key lncRNA-target
1.Differential regulations page:
1).Search bar:
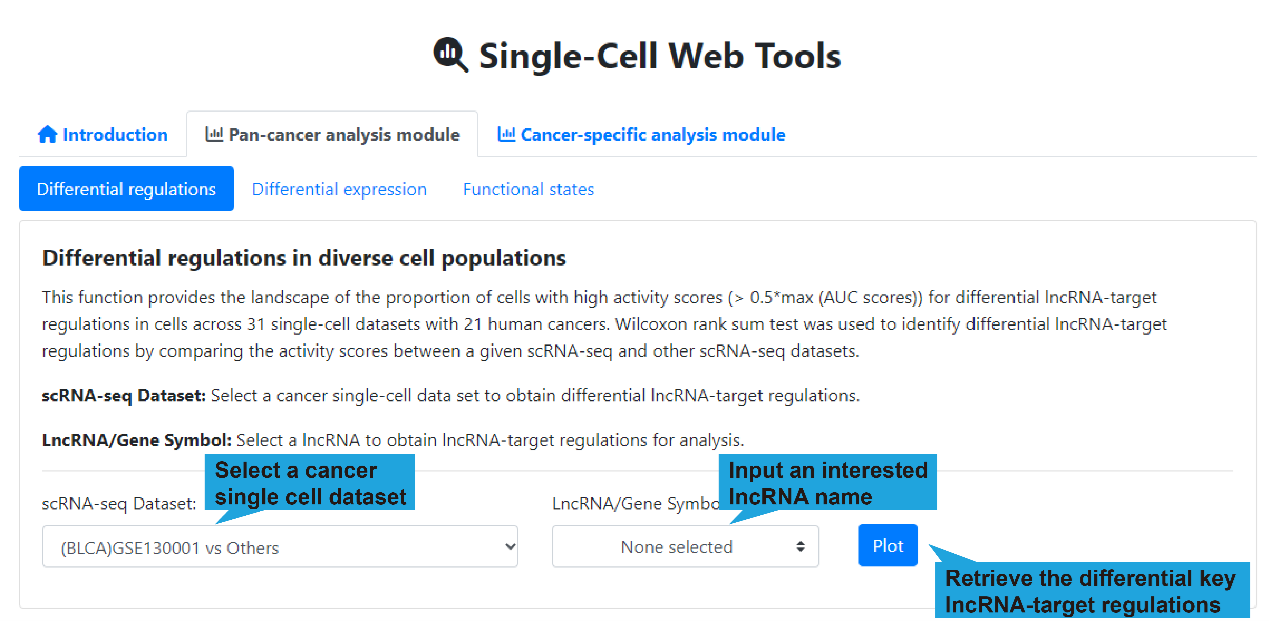
This function provides the landscape of the proportion of cells with high activity
scores for differential lncRNA-target regulations in cells across 31 single-cell
datasets (>500 cells). To analyze the differences in lncRNA-target regulation
between different datasets, you should select a cancer single-cell dataset and input
an interested lncRNA name first, and then click the “Plot” button to retrieve the
differential lncRNA-target regulations. If no interested lncRNA is inputted, all
differential lncRNA-target regulations between a given single-cell scRNA-seq and
other scRNA-seq datasets are displayed.
scRNA-seq Dataset:Select a cancer single-cell dataset to obtain differential
lncRNA-target regulations.
LncRNA/Gene Symbol:Select a lncRNA to obtain key lncRNA-target regulations for
analysis. (optional)
2).Differential regulations in cells across single-cell datasets
The dot plot shown below presents top differential regulations for the selected dataset.
To show the differential lncRNA-target regulations in different datasets, first, the CSN
method was used to identify whether the lncRNA-target regulation existed in the cells.
According to the results, the cells were divided into two groups for differential
expression analysis. The results of differential expression are shown in the table
below. The Wilcoxon rank sum test was used to identify genes whose expression was
significantly associated with the regulation (|logFC|>1, FDR<0.05), and AUCell was
used to determine the activity of each regulon (set of differential expression genes) as
the activity of that regulation in the cell. Finally, Wilcoxon rank sum test was
used to identify the significance of the difference between the selected dataset and
other datasets. At the same time, to determine the 'on/off' activity of each regulon
in each dataset, we used '0.5* Max (AUC scores)' for each regulon as a threshold to
binarize the regulon activity scores. The size and color of each point in the dot
plot below correspond to the ratio of the lncRNA regulatory relationship to the
total number of cells in the 'on' state in the dataset. The order of pairs of lncRNA
regulatory relations was determined based on the number and size of datasets that
differed significantly from the selected ones as shown in the figure below. Finally,
Wilcoxon rank sum test was used to identify differential lncRNA-target regulations
by comparing the activity scores between a given single-cell dataset and other
datasets.
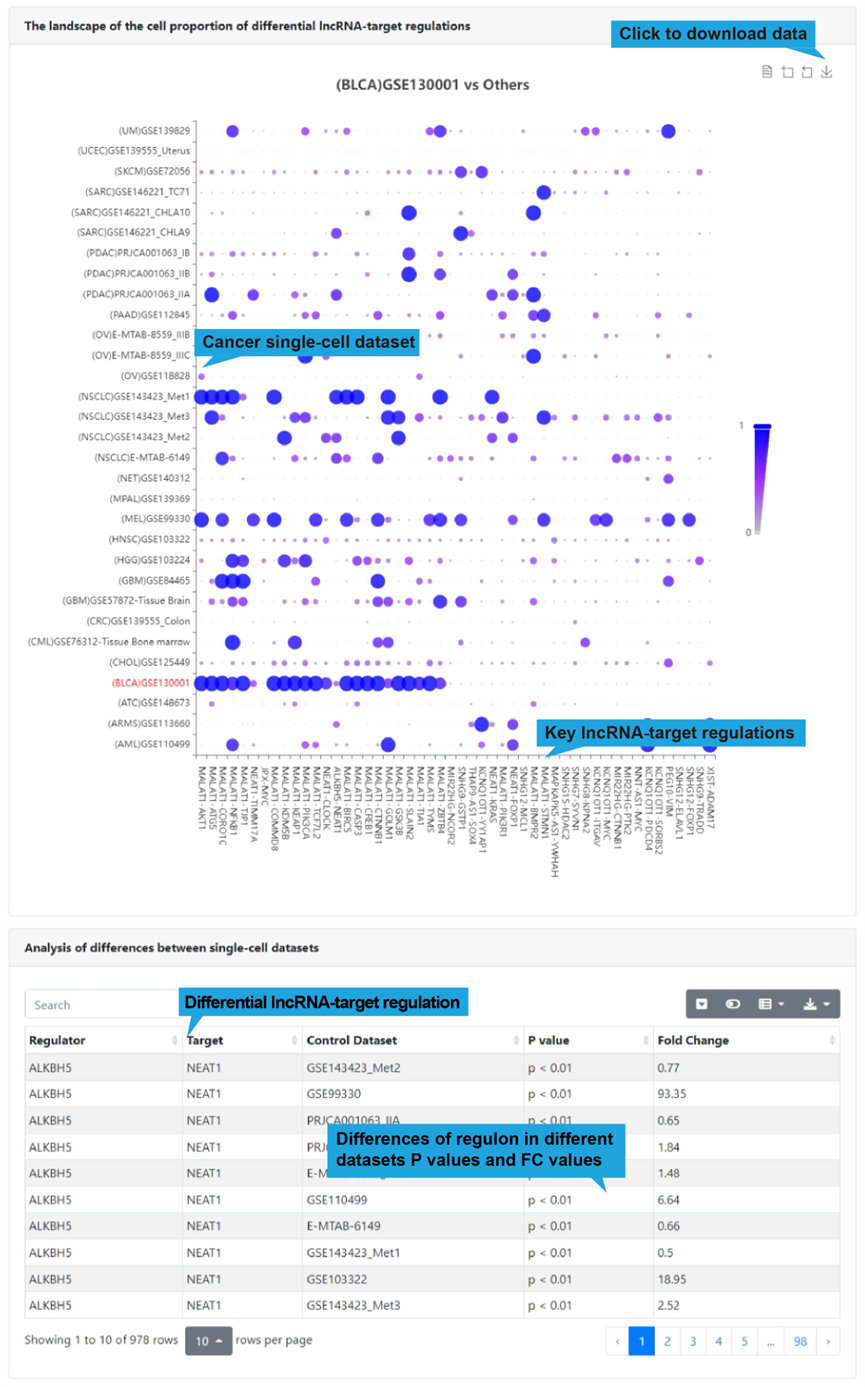
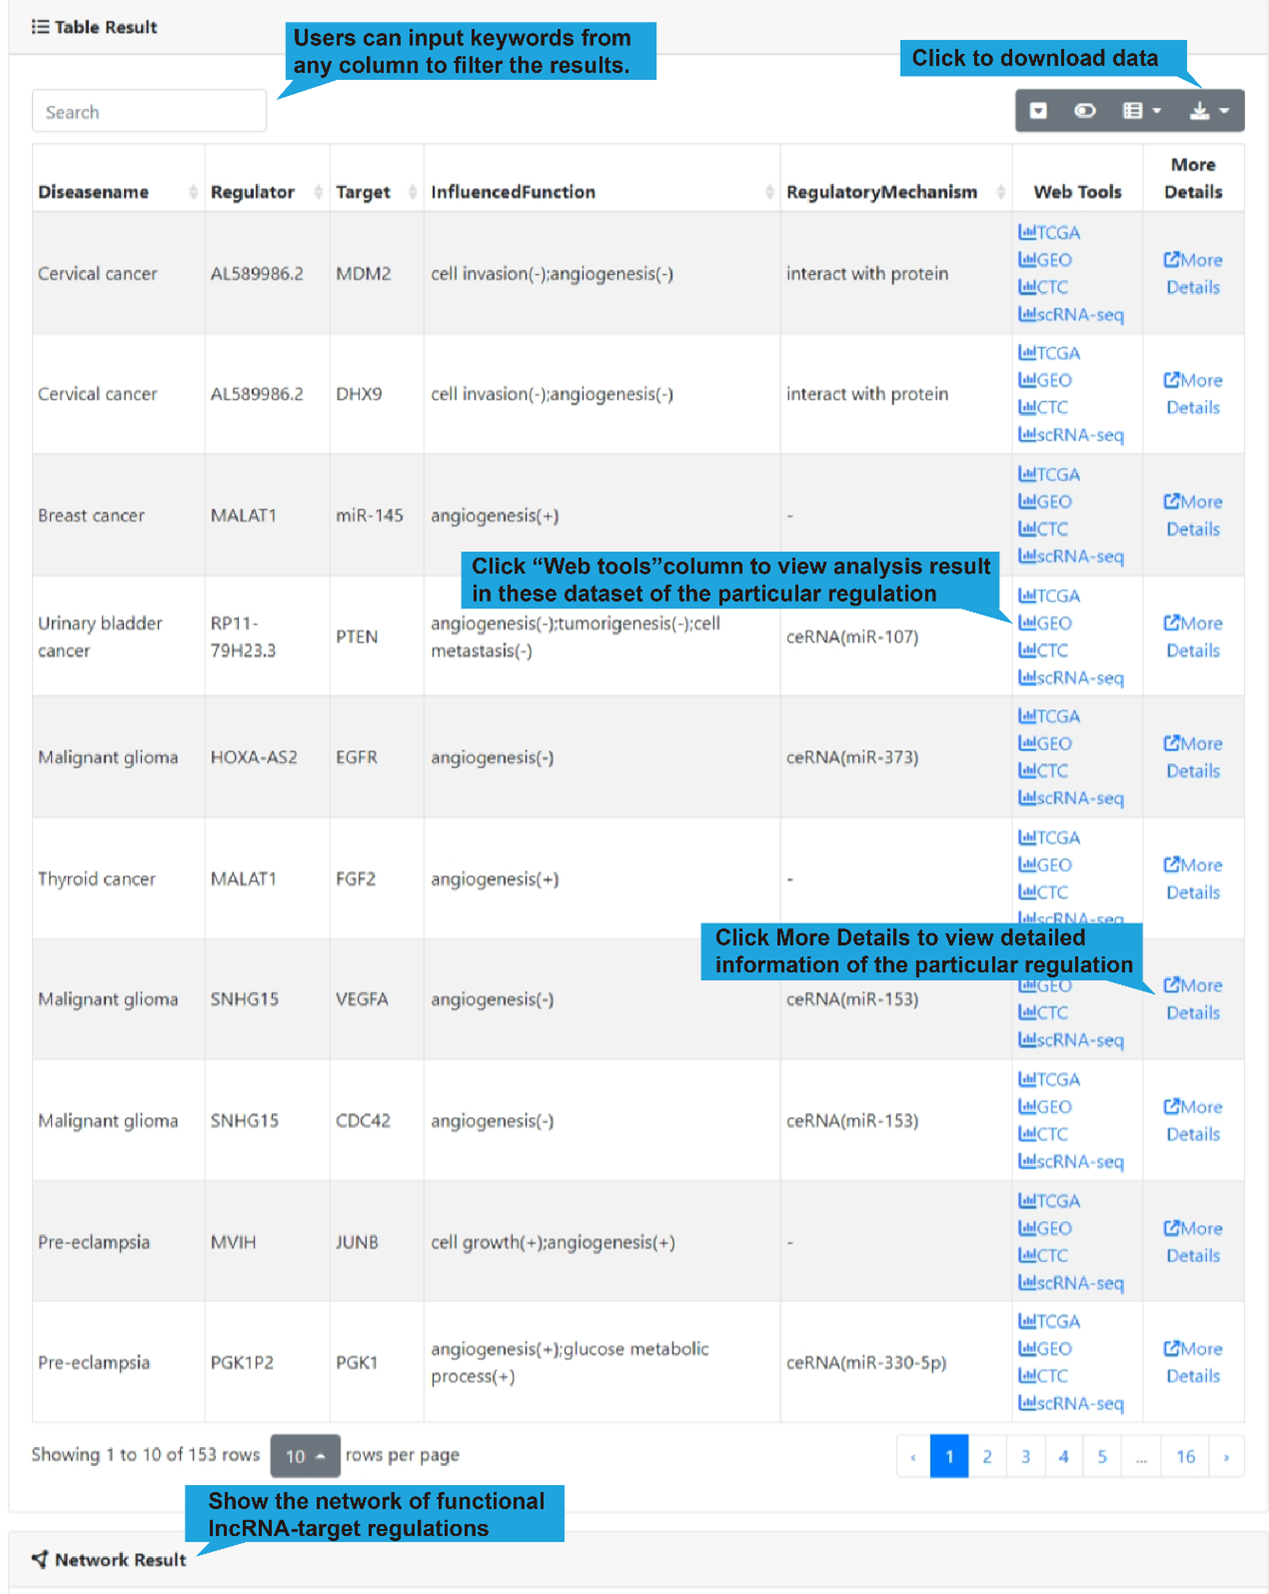
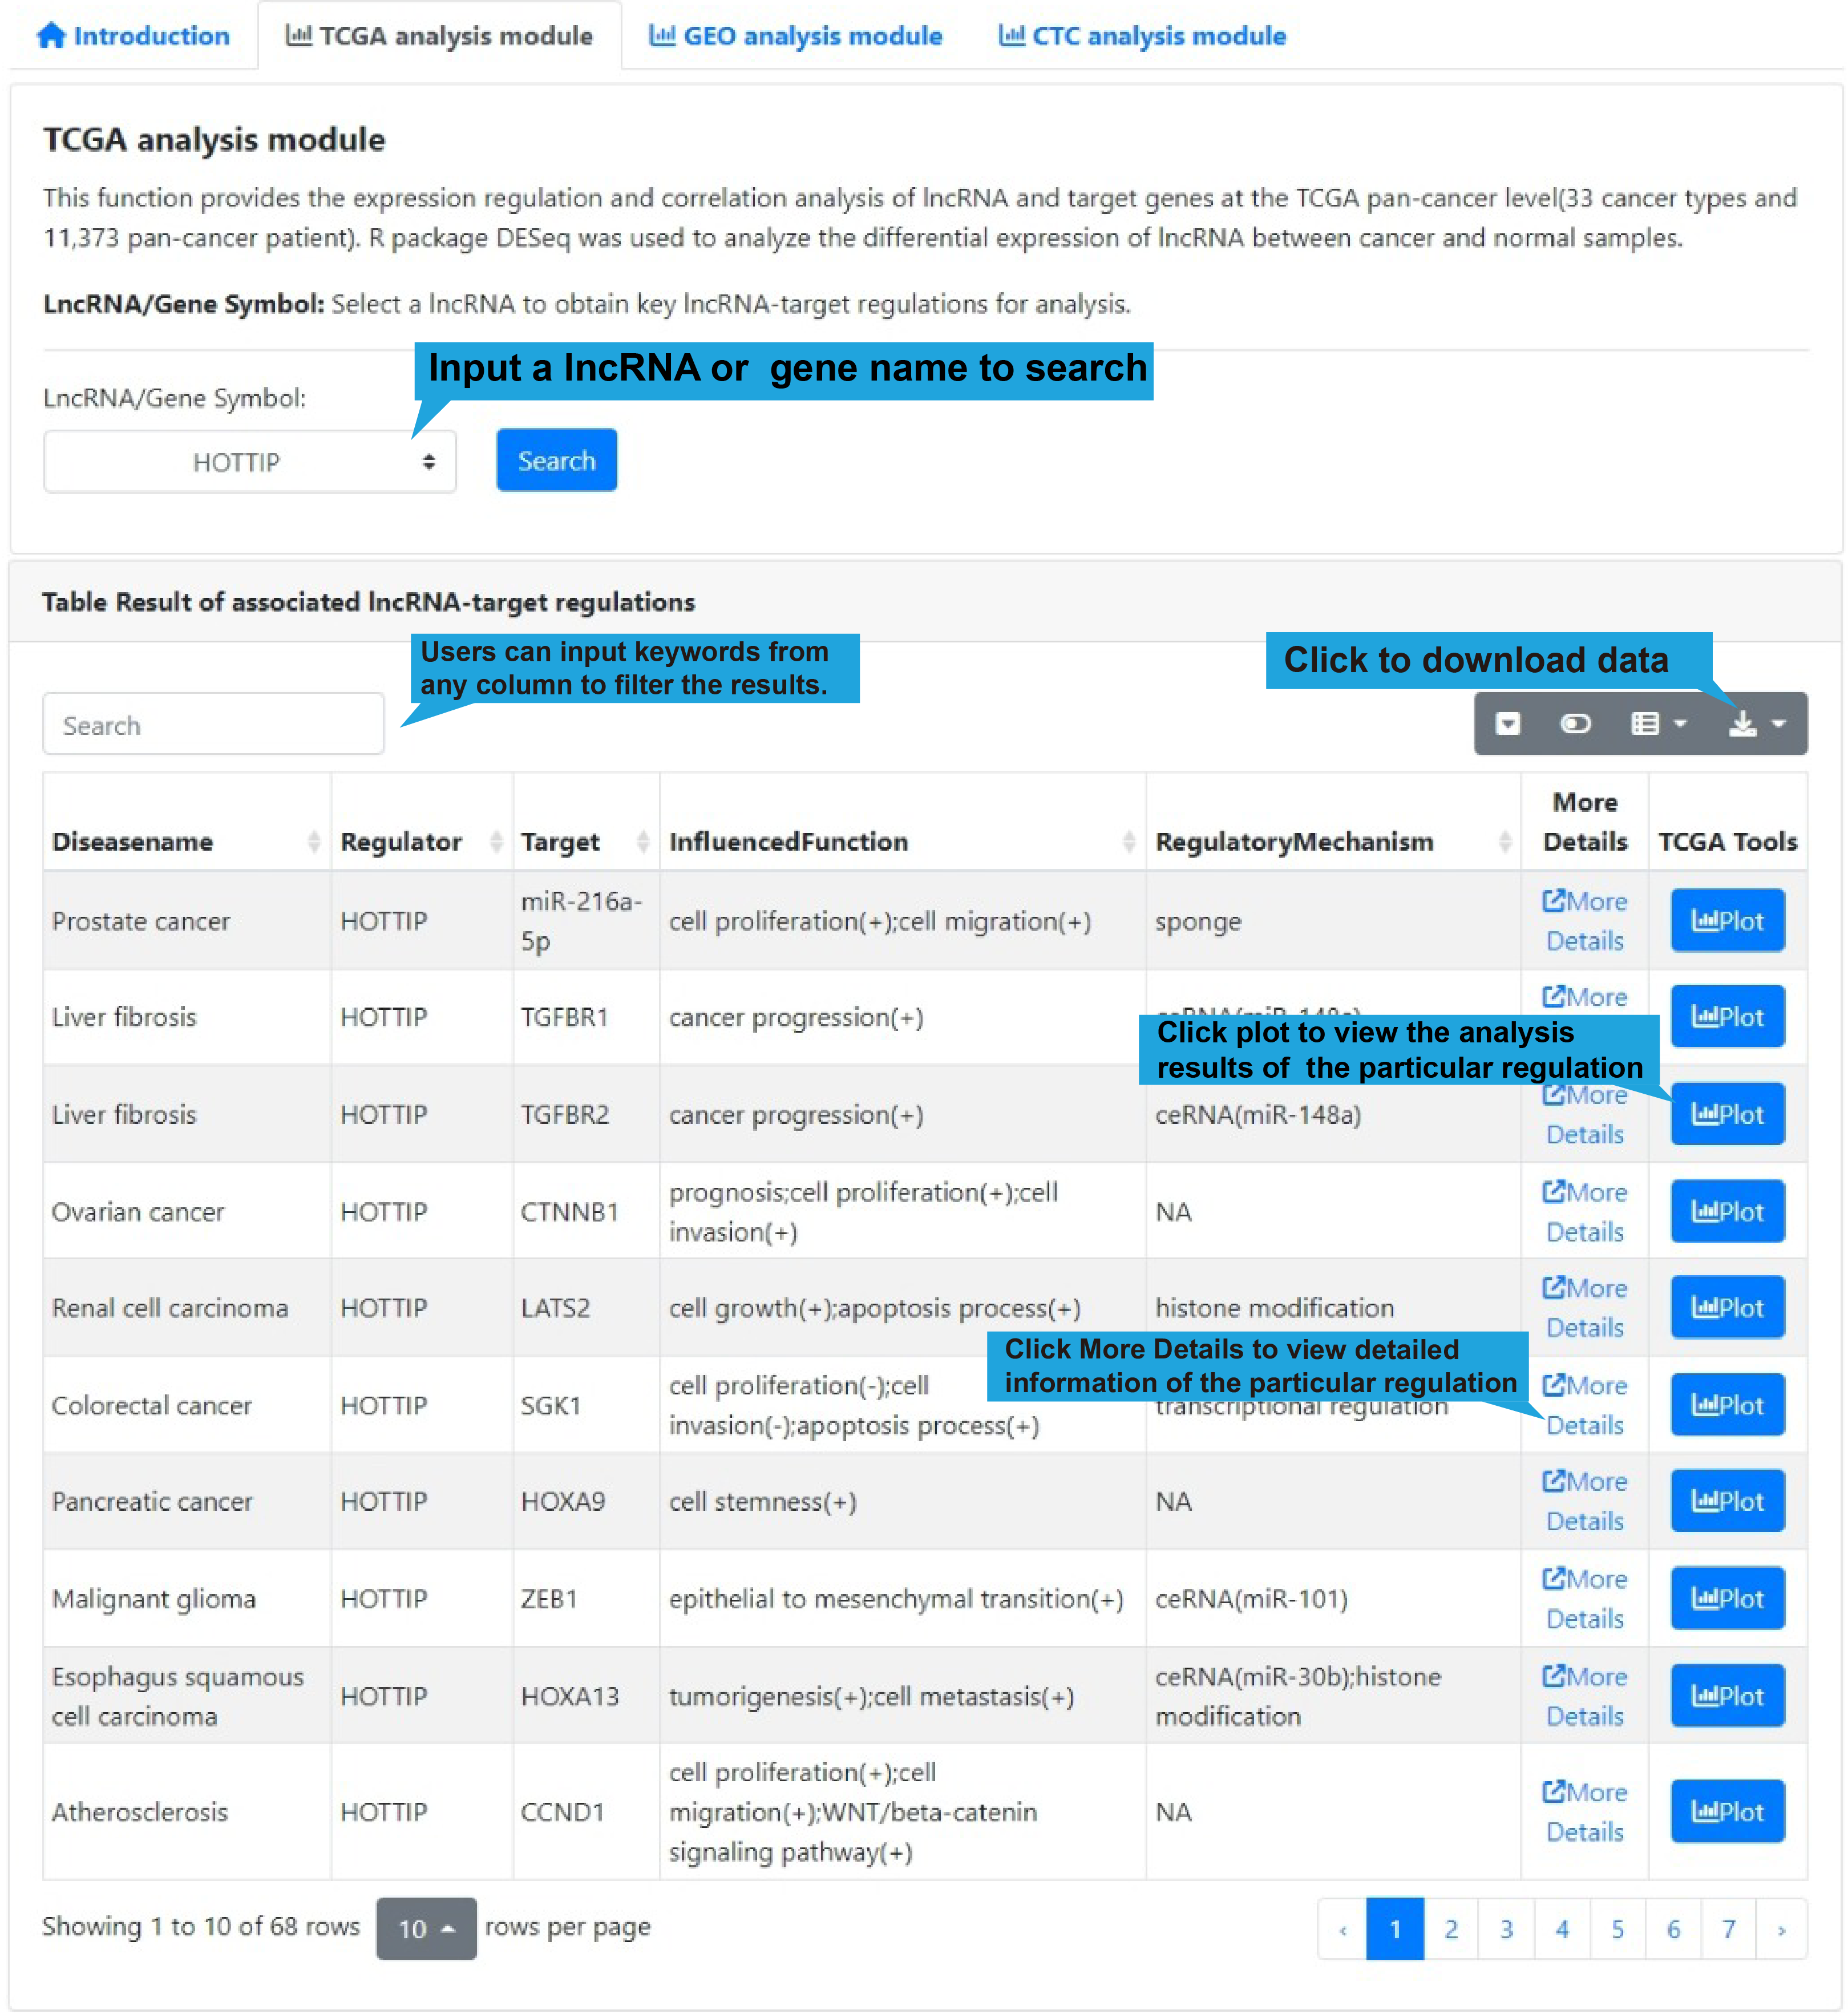
All differential lncRNA-target regulations in the select single-cell dataset are listed
in a table below the dot plot, with each lncRNA-target regulation in one row, including
disease name, lncRNA name, target name, influenced biological functions and regulatory
mechanism. Users can click “Web Tools” column to get lncRNA and target analysis tools.
Use the search box in the upper left corner to quickly retrieve items of interest. Use
the buttons in the upper right corner to reformat the table and export data.
DiseaseName: The associated disease.
Regulator: The name of regulator gene, such as an lncRNA.
Target: The name of target gene.
InfluencedFunctions: The biological function positively (+) or negatively (-)
affected
by the lncRNA-target regulation in human disease.
RegulatoryMechanism: lncRNA-mediated regulatory mechanism in human disease,
including
transcriptional regulation, epigenetic regulation, chromatin looping, ceRNA or
sponge,
interacting with mRNA and interacting with protein.
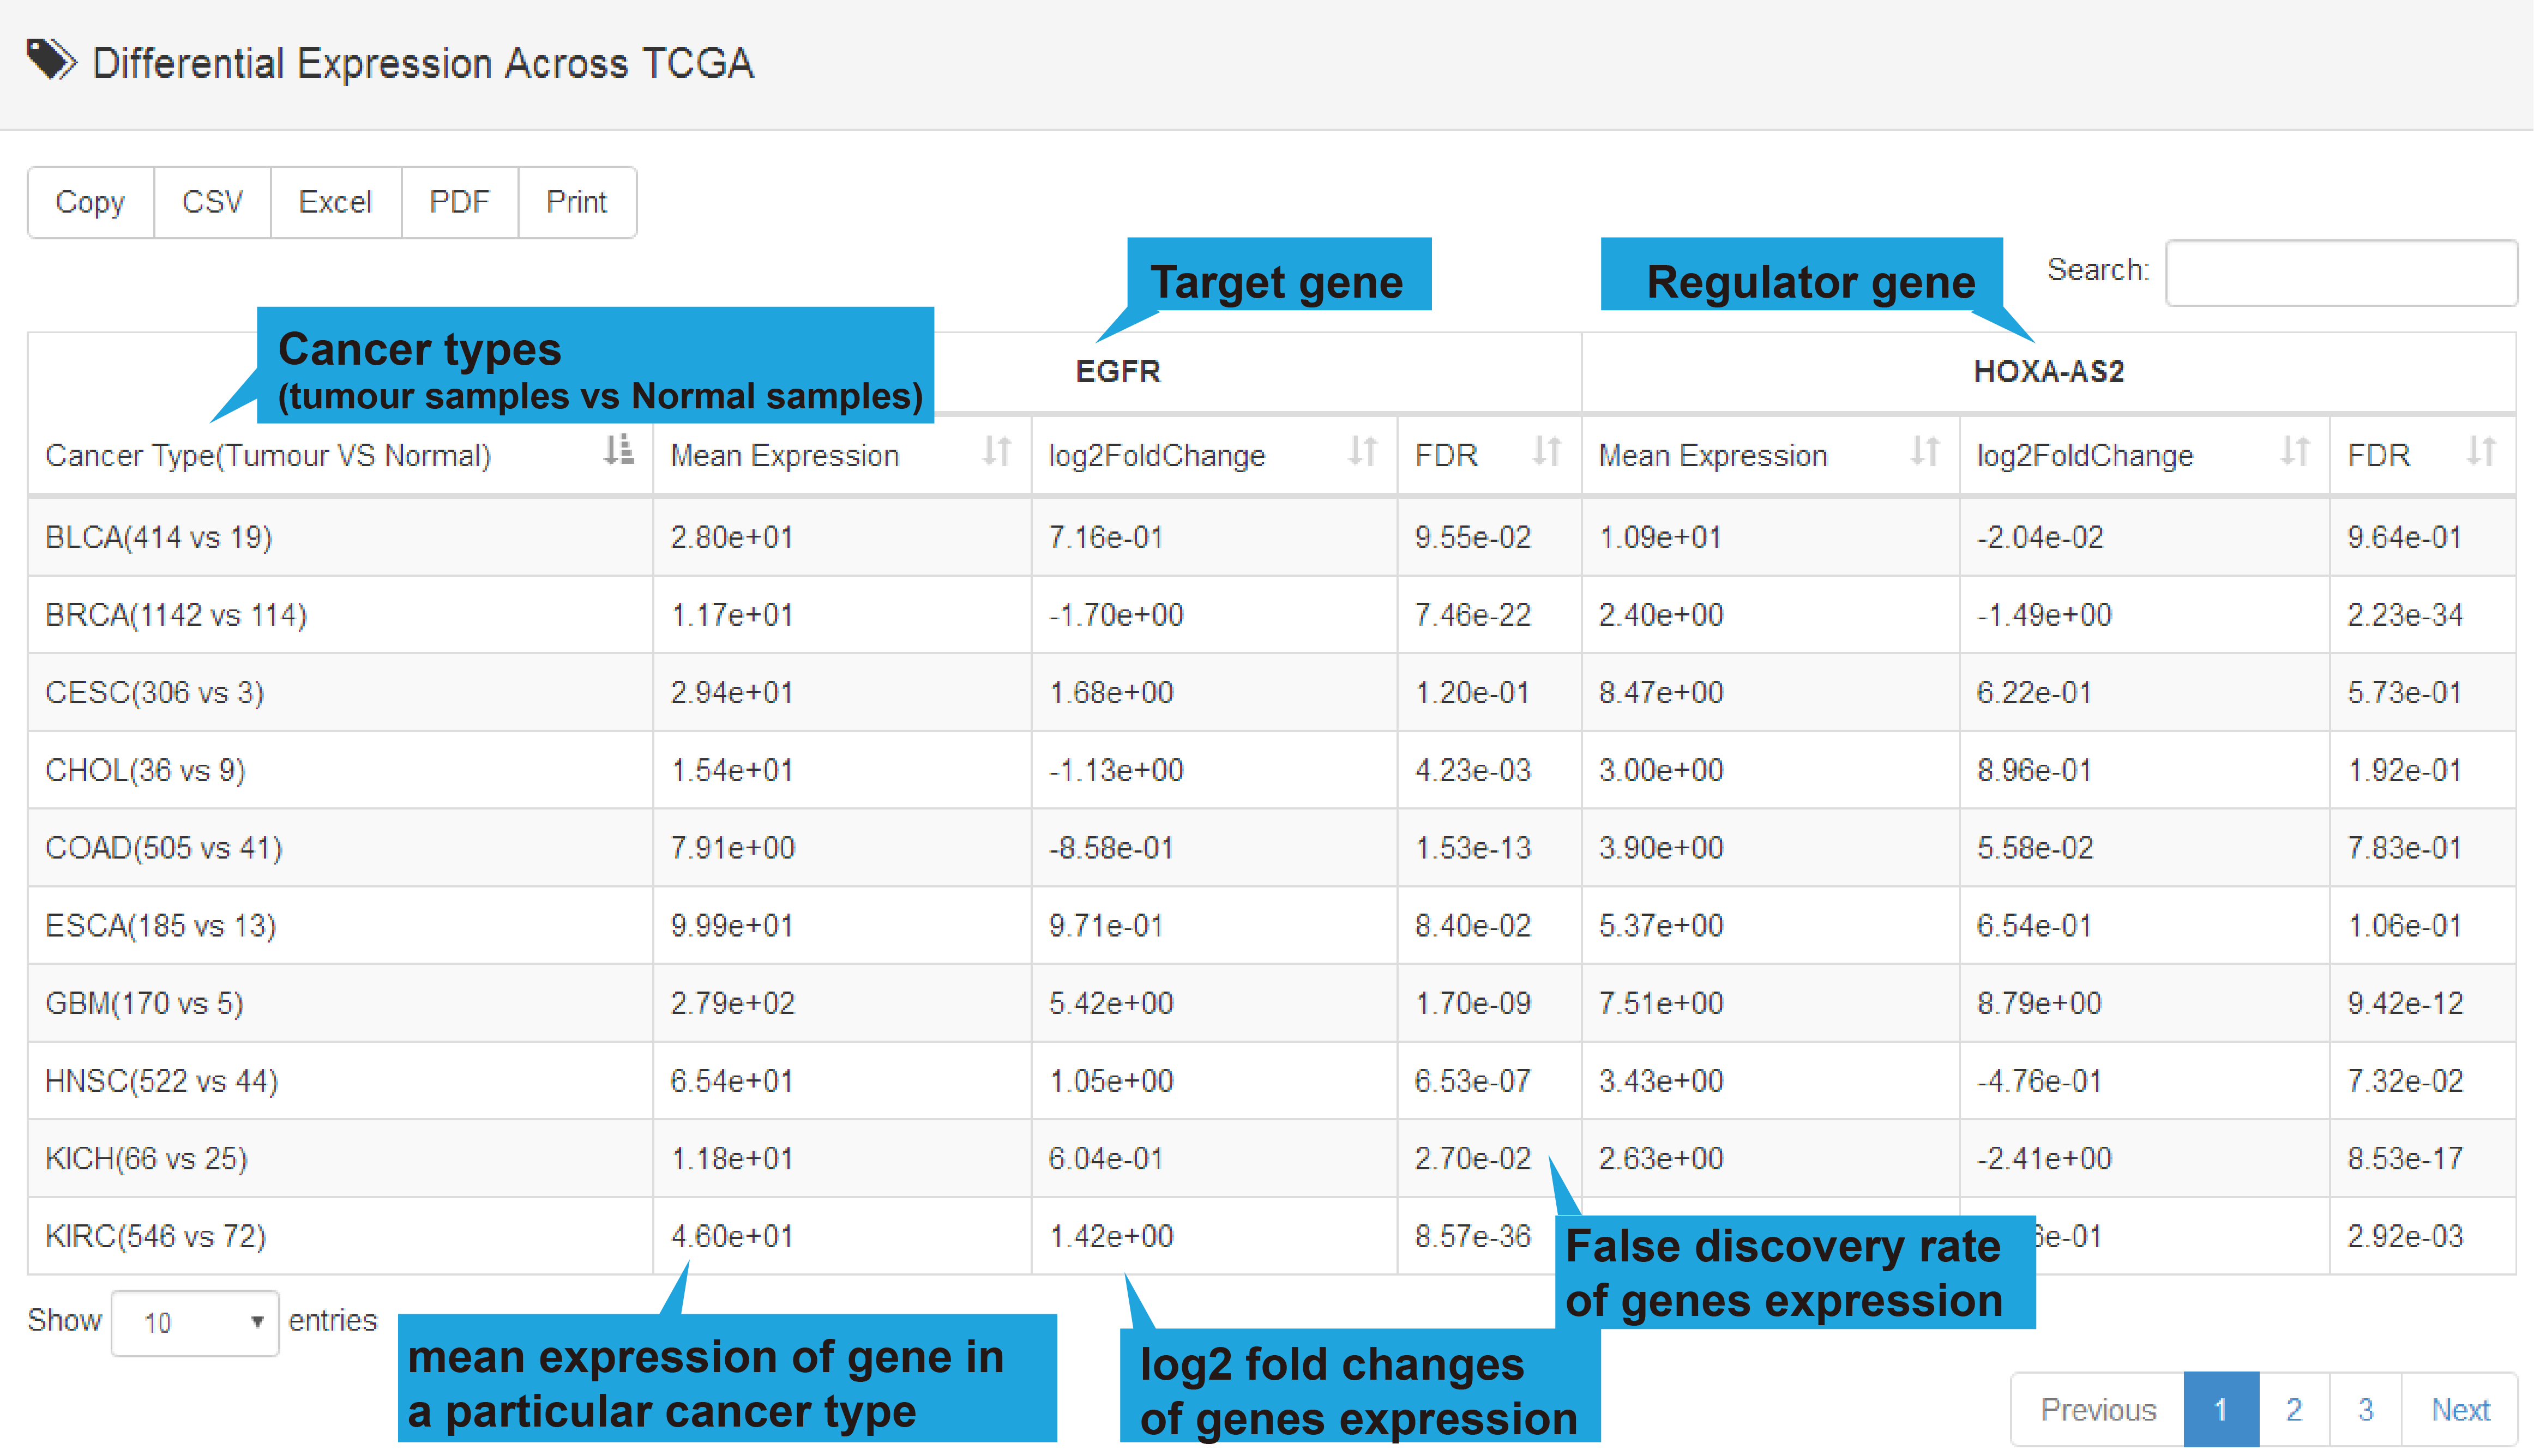
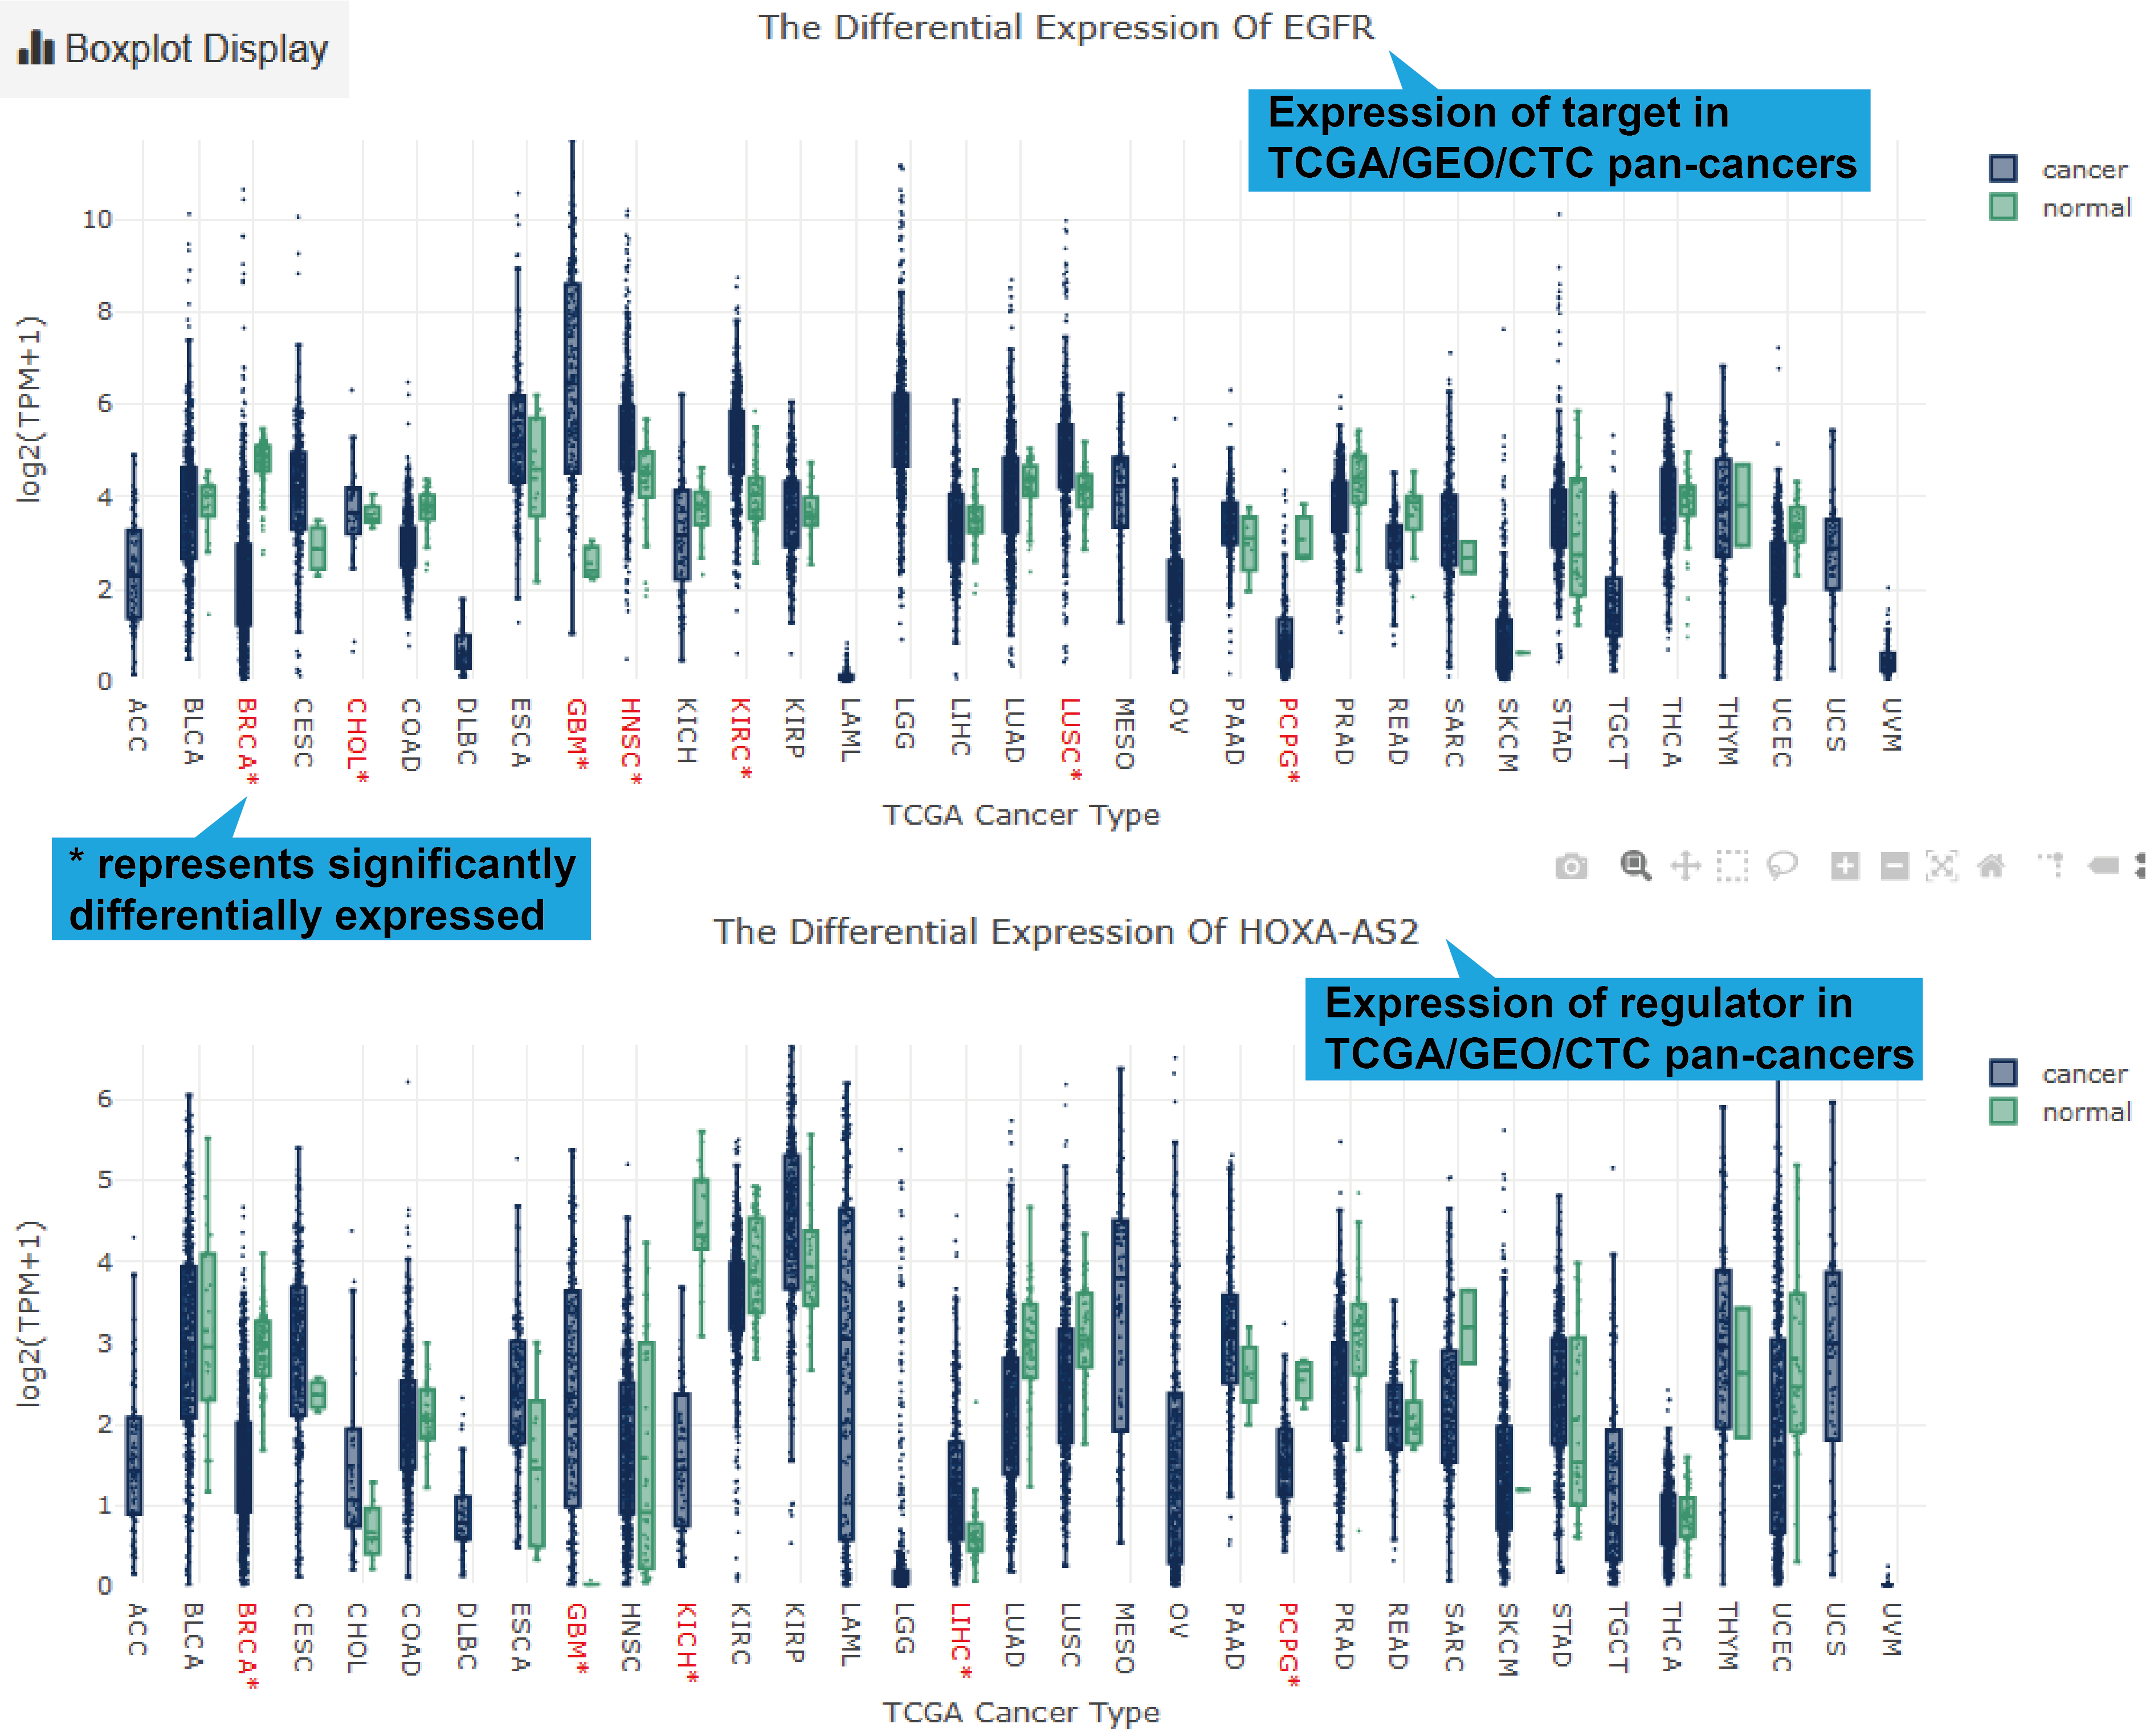
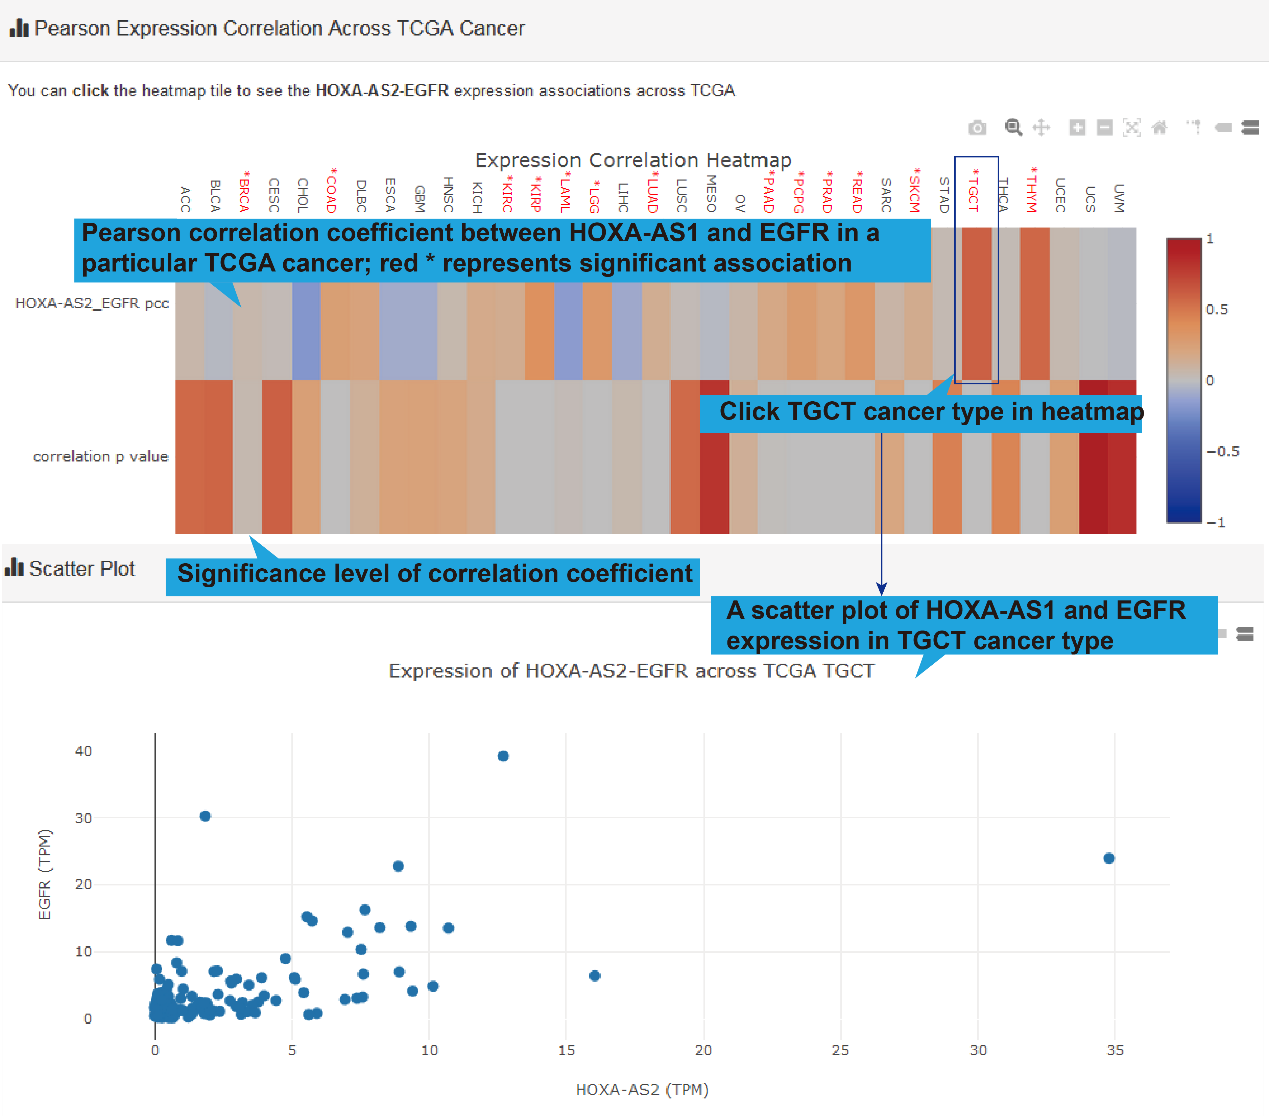
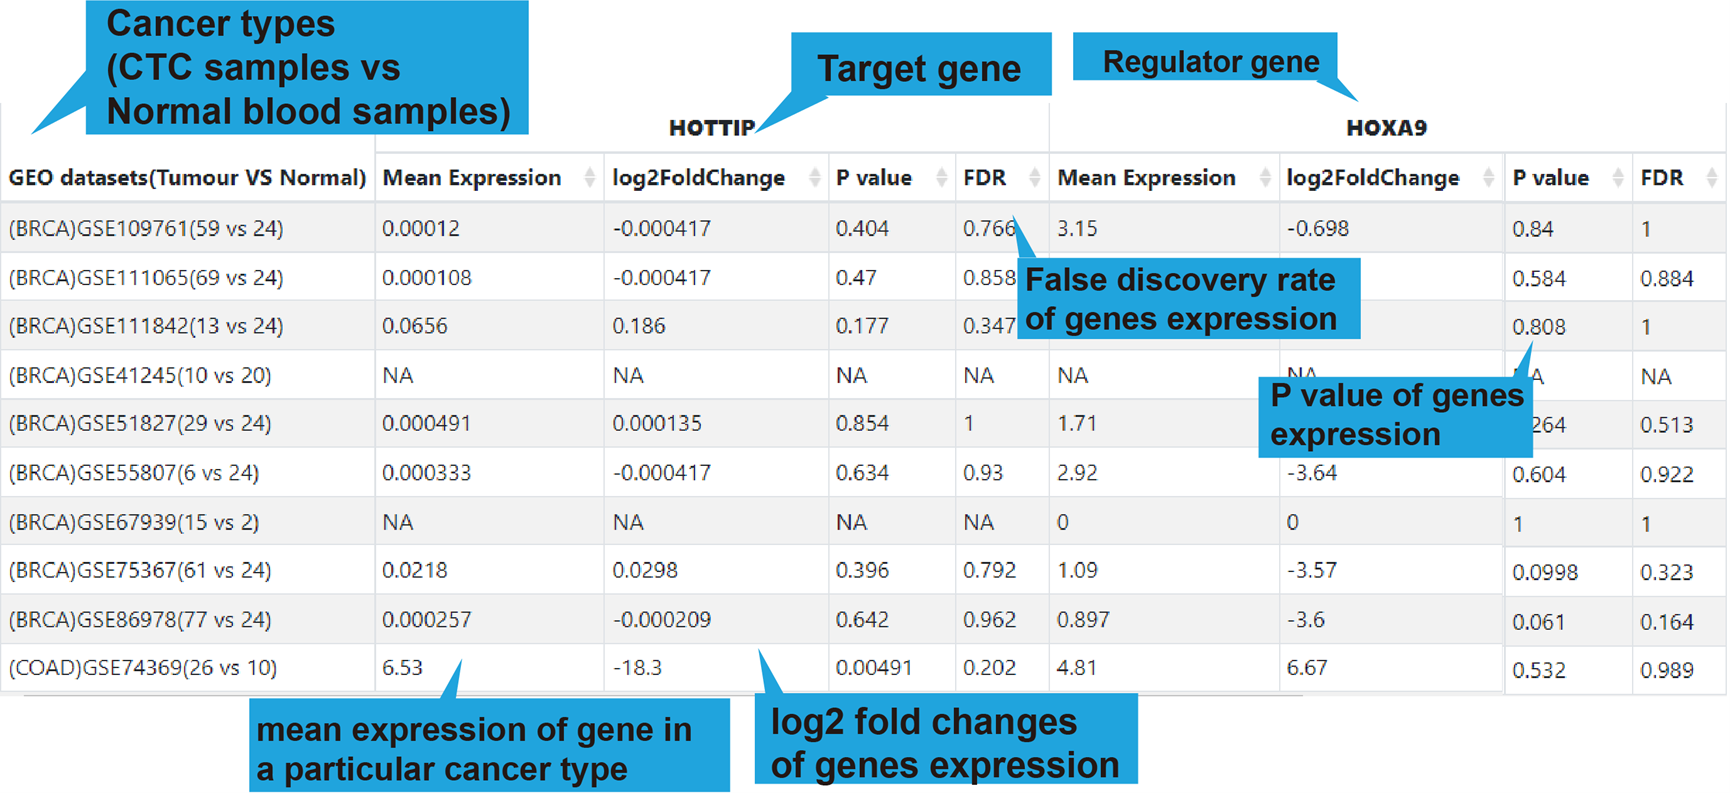
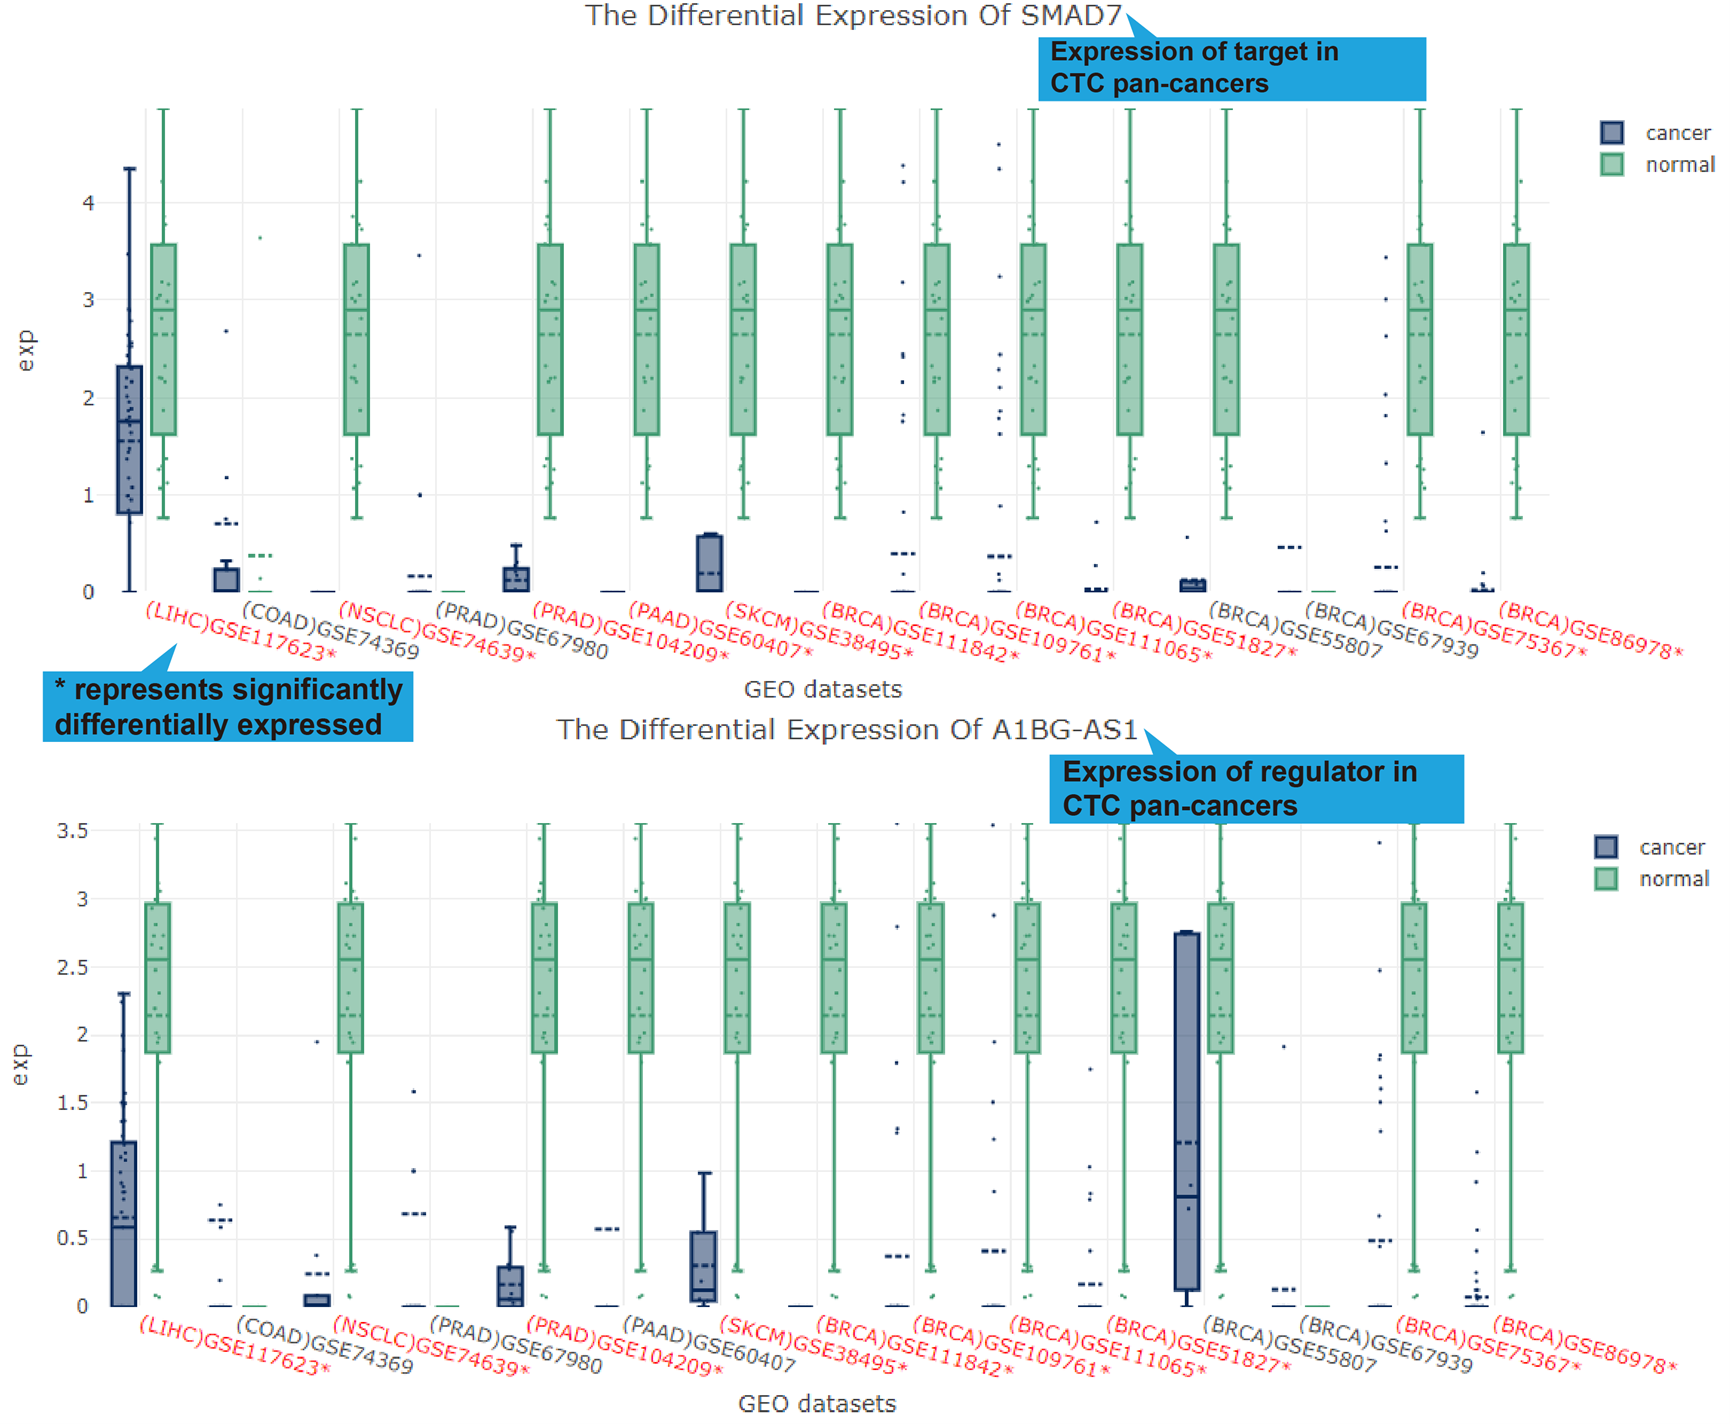
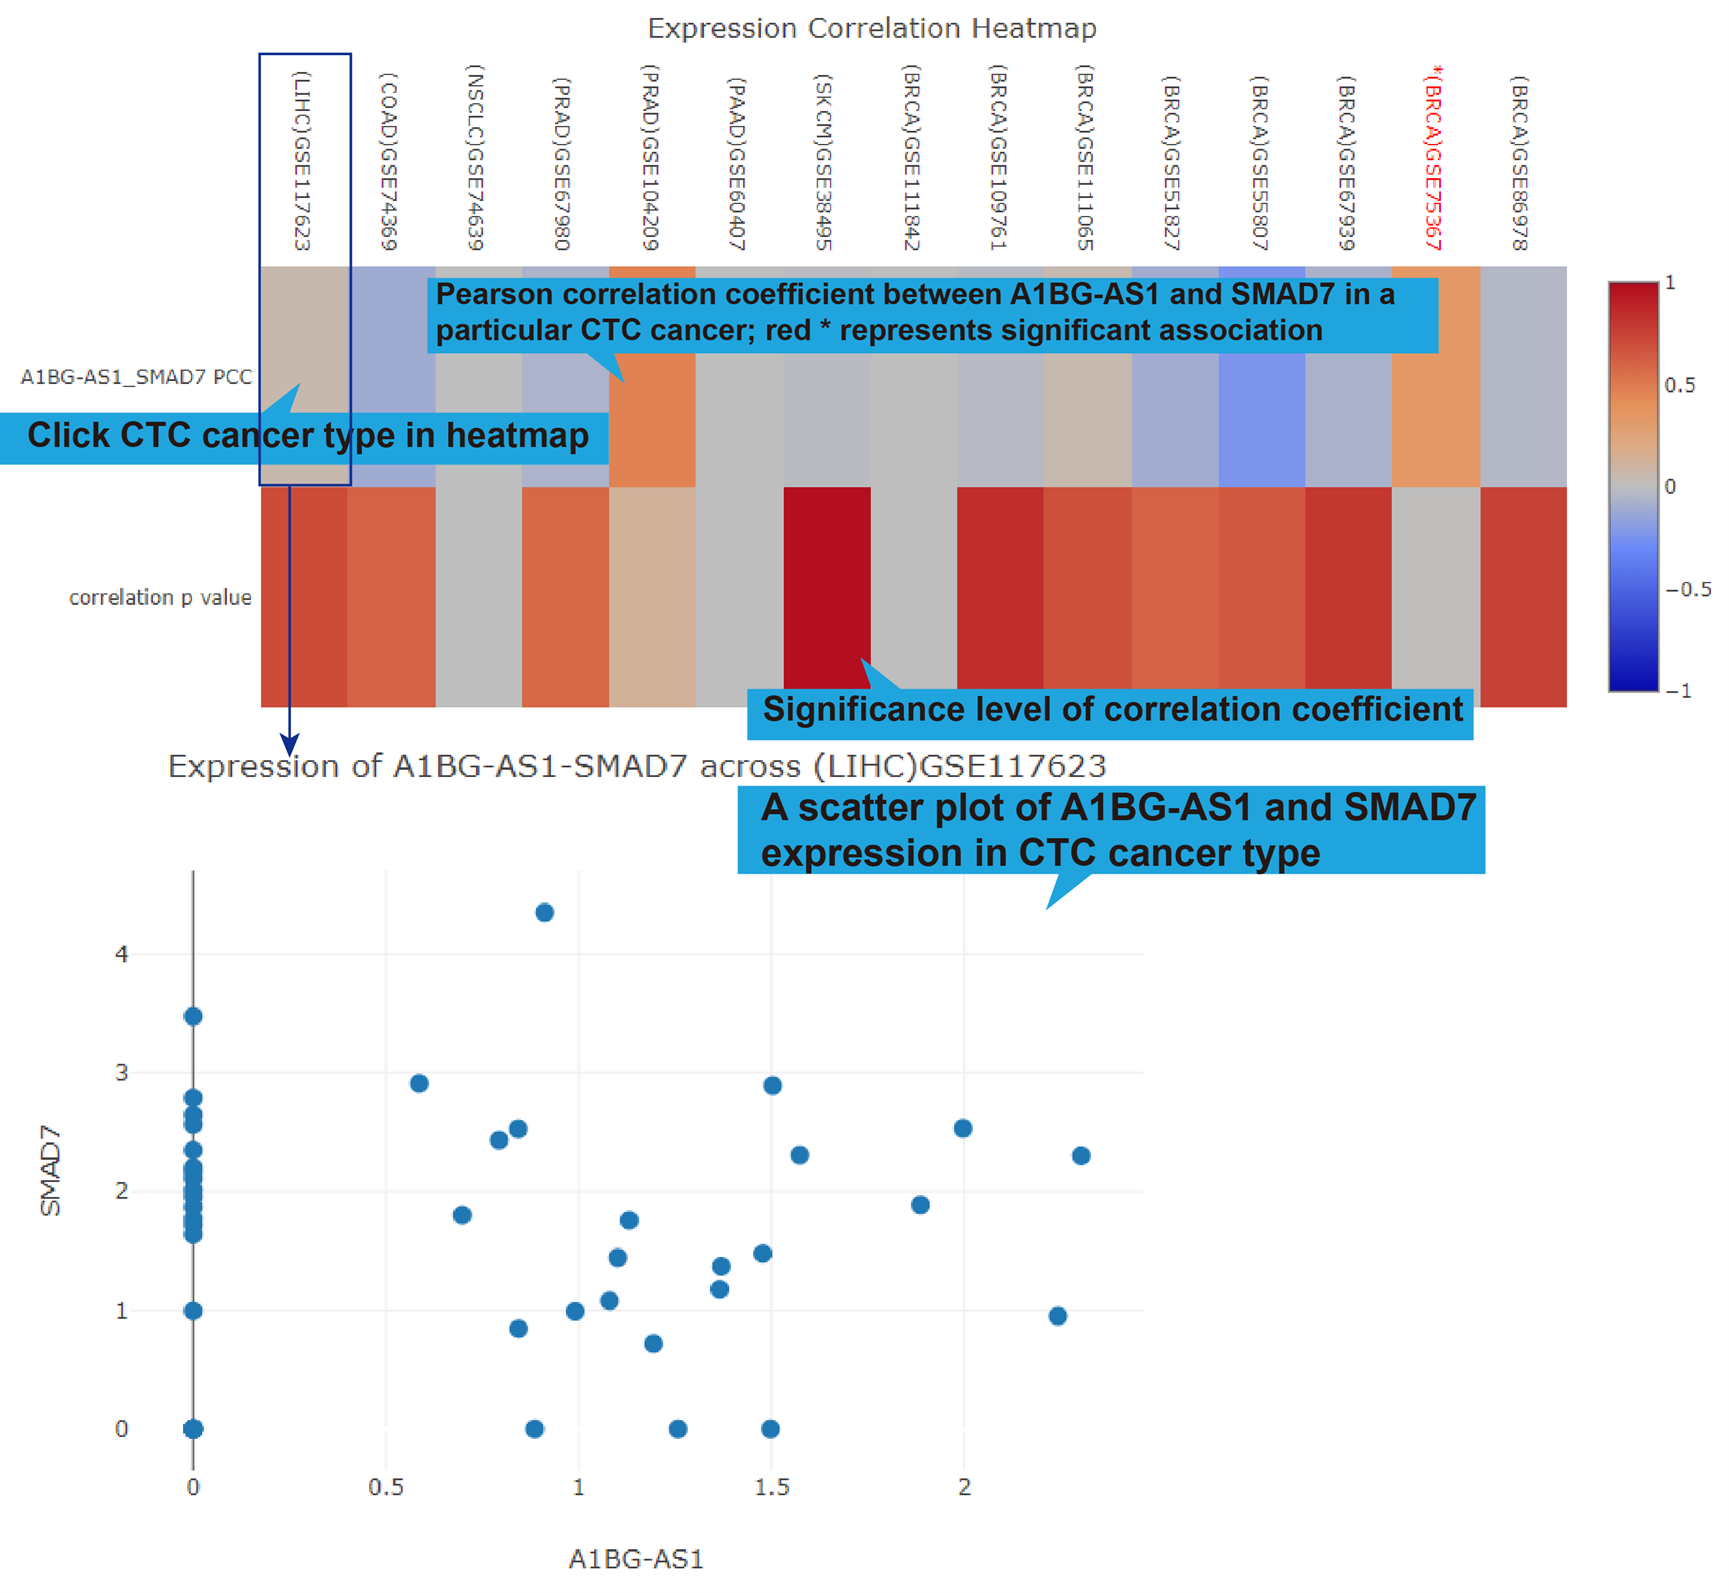
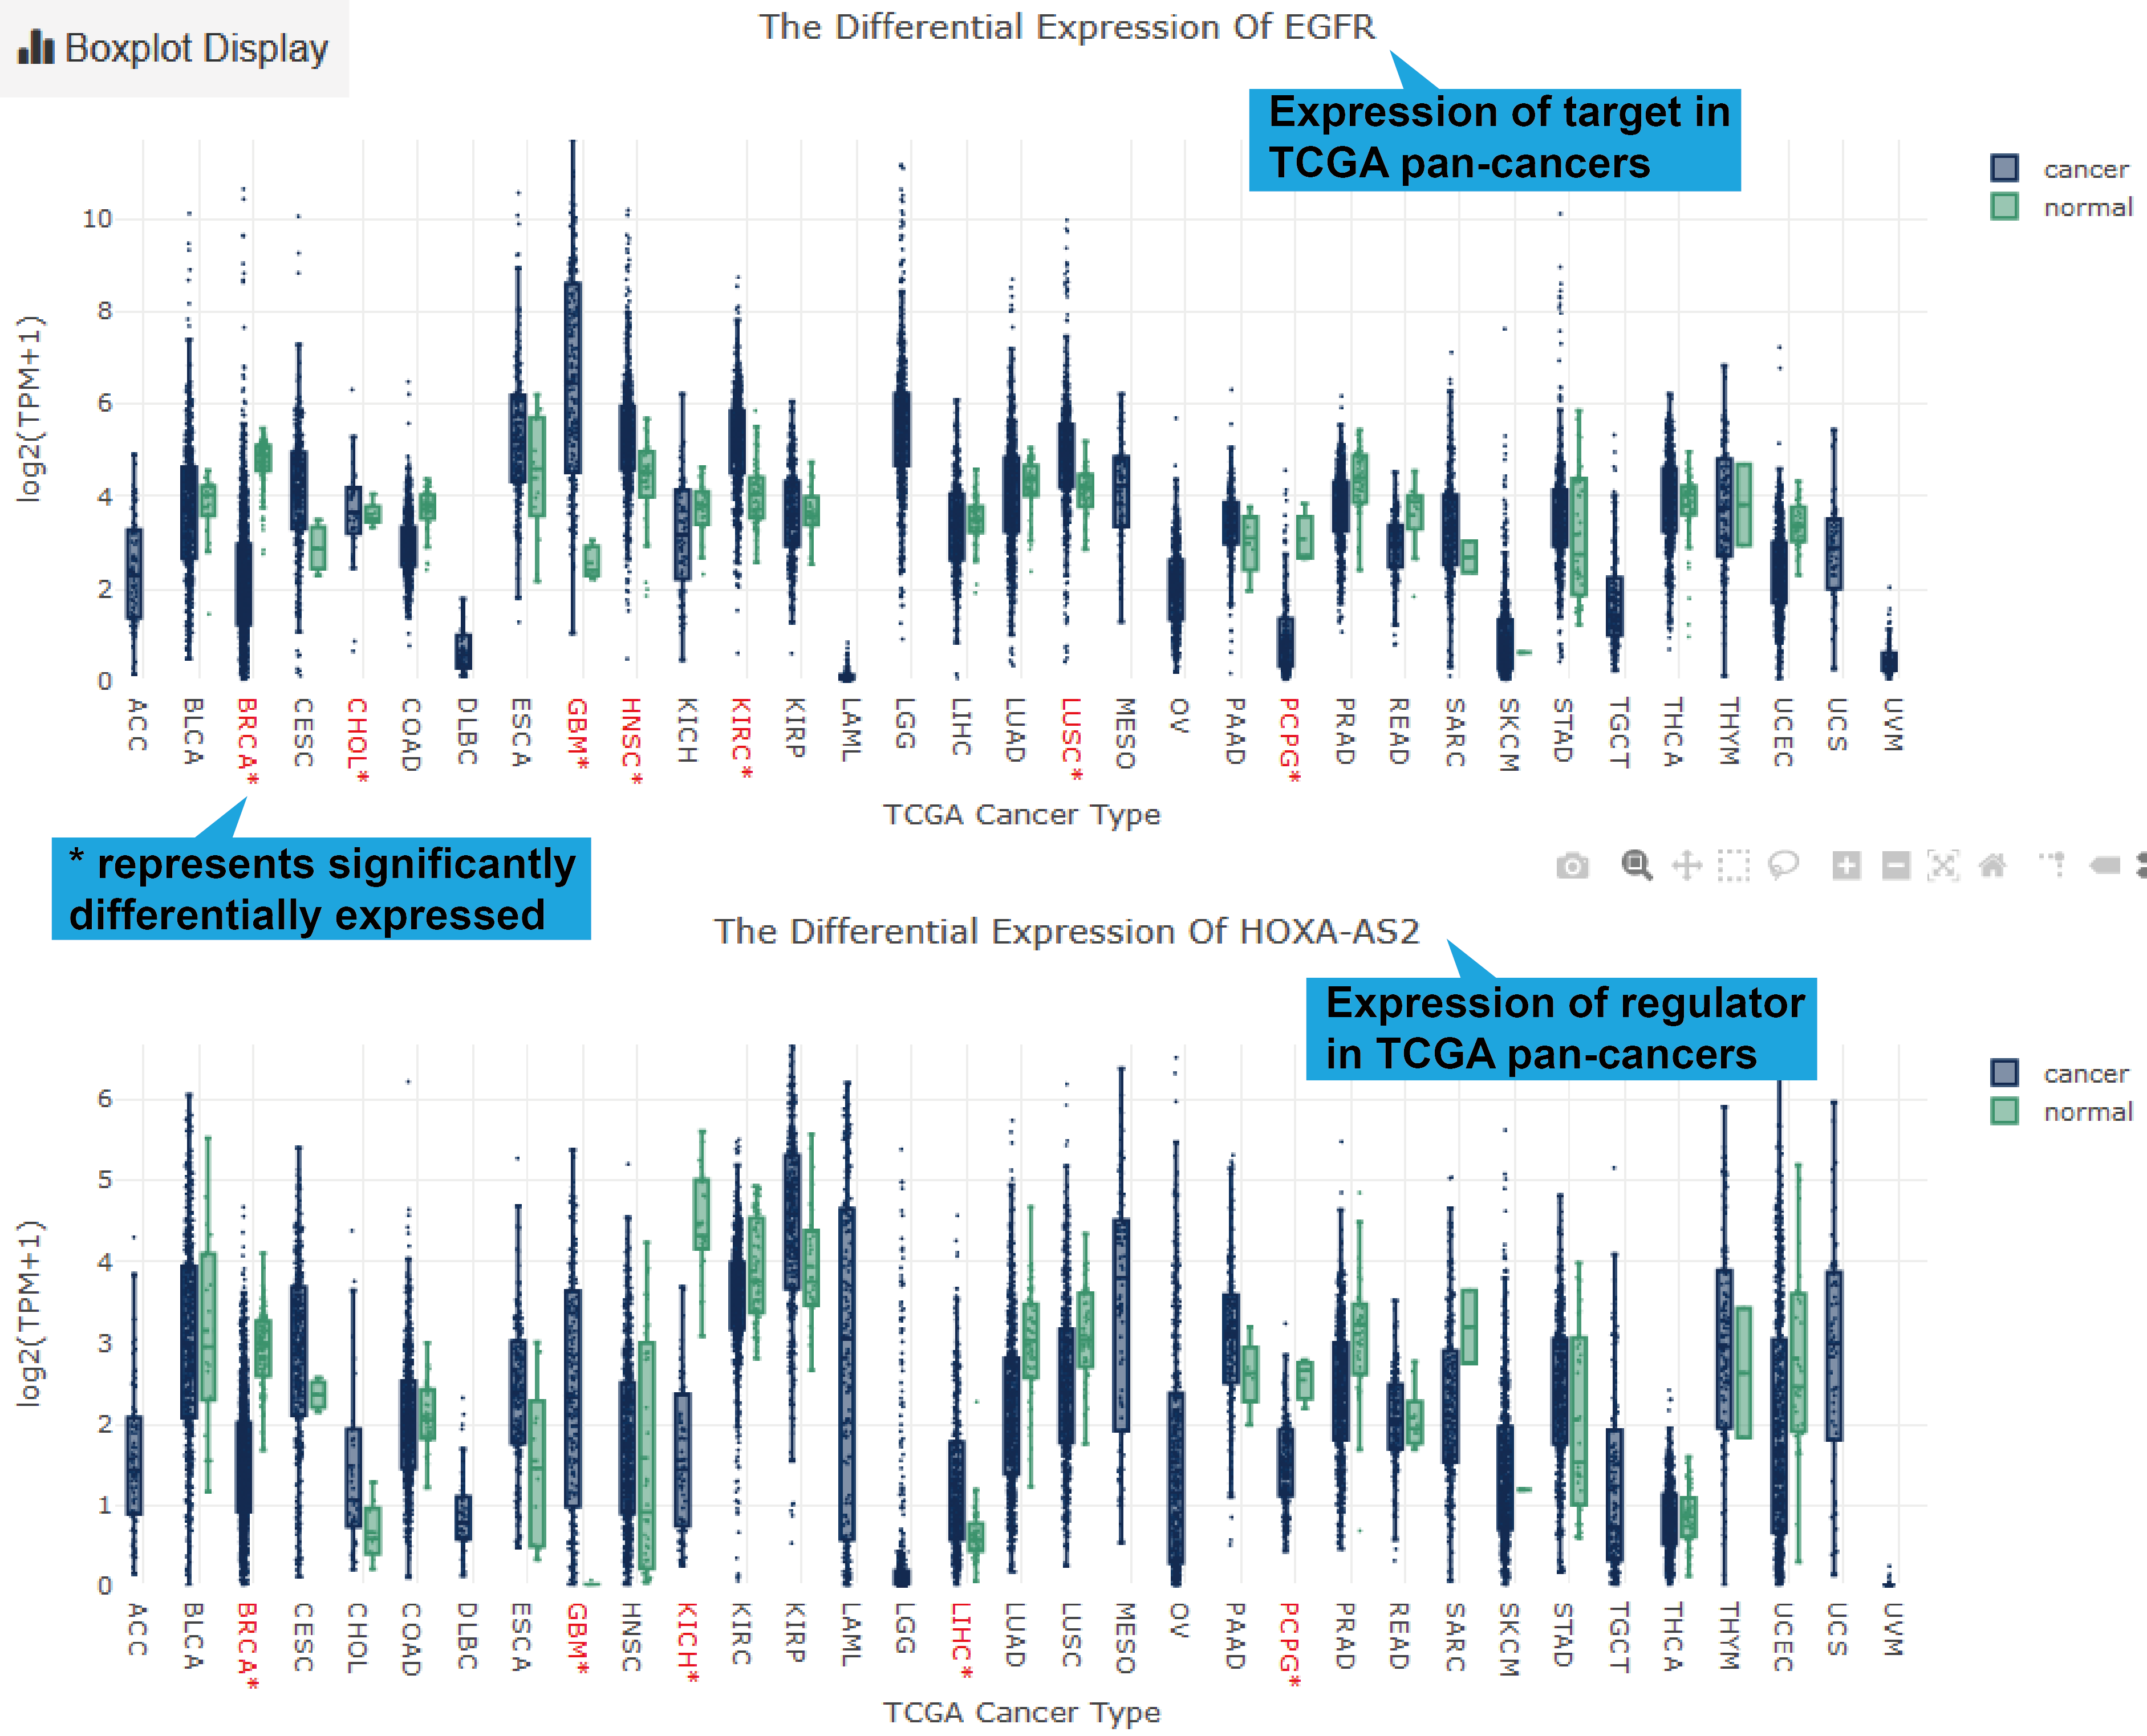
Web Tools: Clickable links for accessing the analysis results of each
lncRNA-target regulation in TCGA, GEO (if available), CTC and Single Cell datasets. For
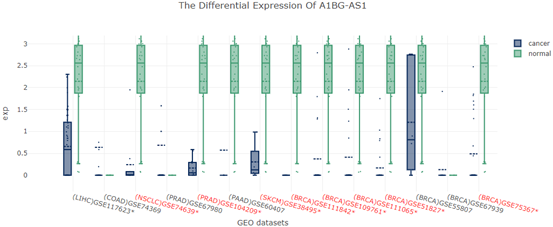
TCGA, GEO and CTC links, their differentially expression patterns, Pearson correlation
coefficient and a scatter plot of lncRNA-target expression in TCGA pan-cancers, GEO
datasets (if available) and CTC datasets will also be shown. As for scRNA-seq links, the
cluster analysis, expression, differential expression, and expression correlation of the
lncRNA-target regulation in different cell types are provided.
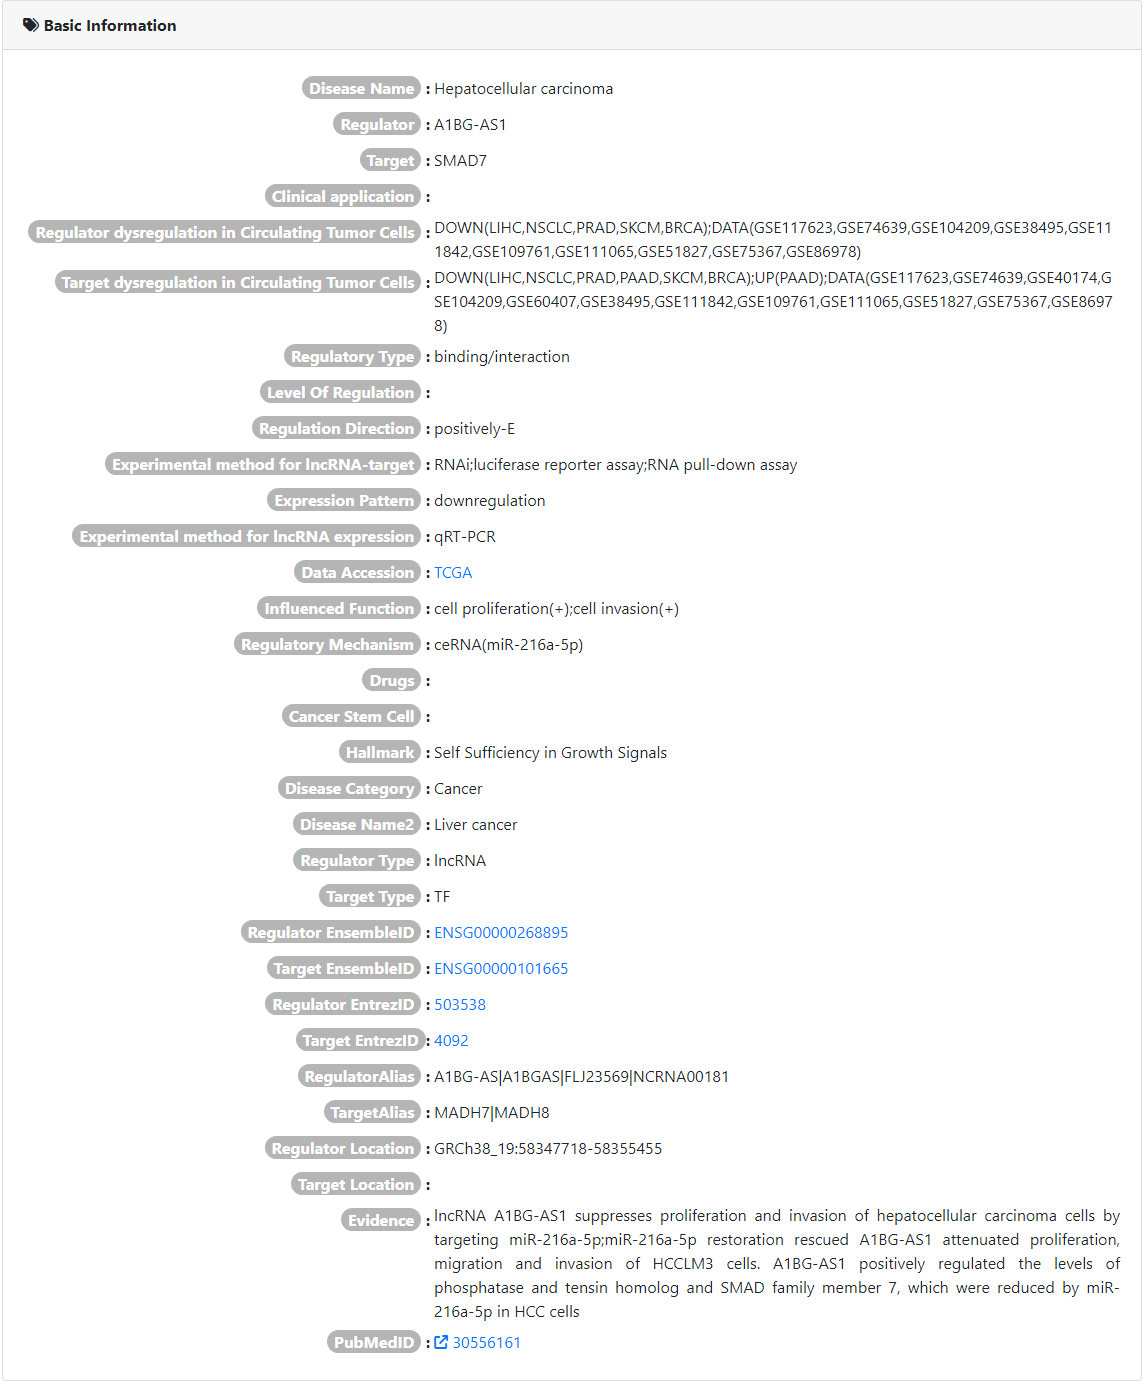
More Details: Clickable links for accessing the detail information of each
lncRNA-target regulation. After clicking the links, the details of the functional
lncRNA-target regulation will be displayed on a new page. The results of the Web Tools
are also provided on the new page.
Single cell tools of Single Cell database.
Select a cancer single-cell data set to obtain lncrNA-target-regulated single-cell
analysis.
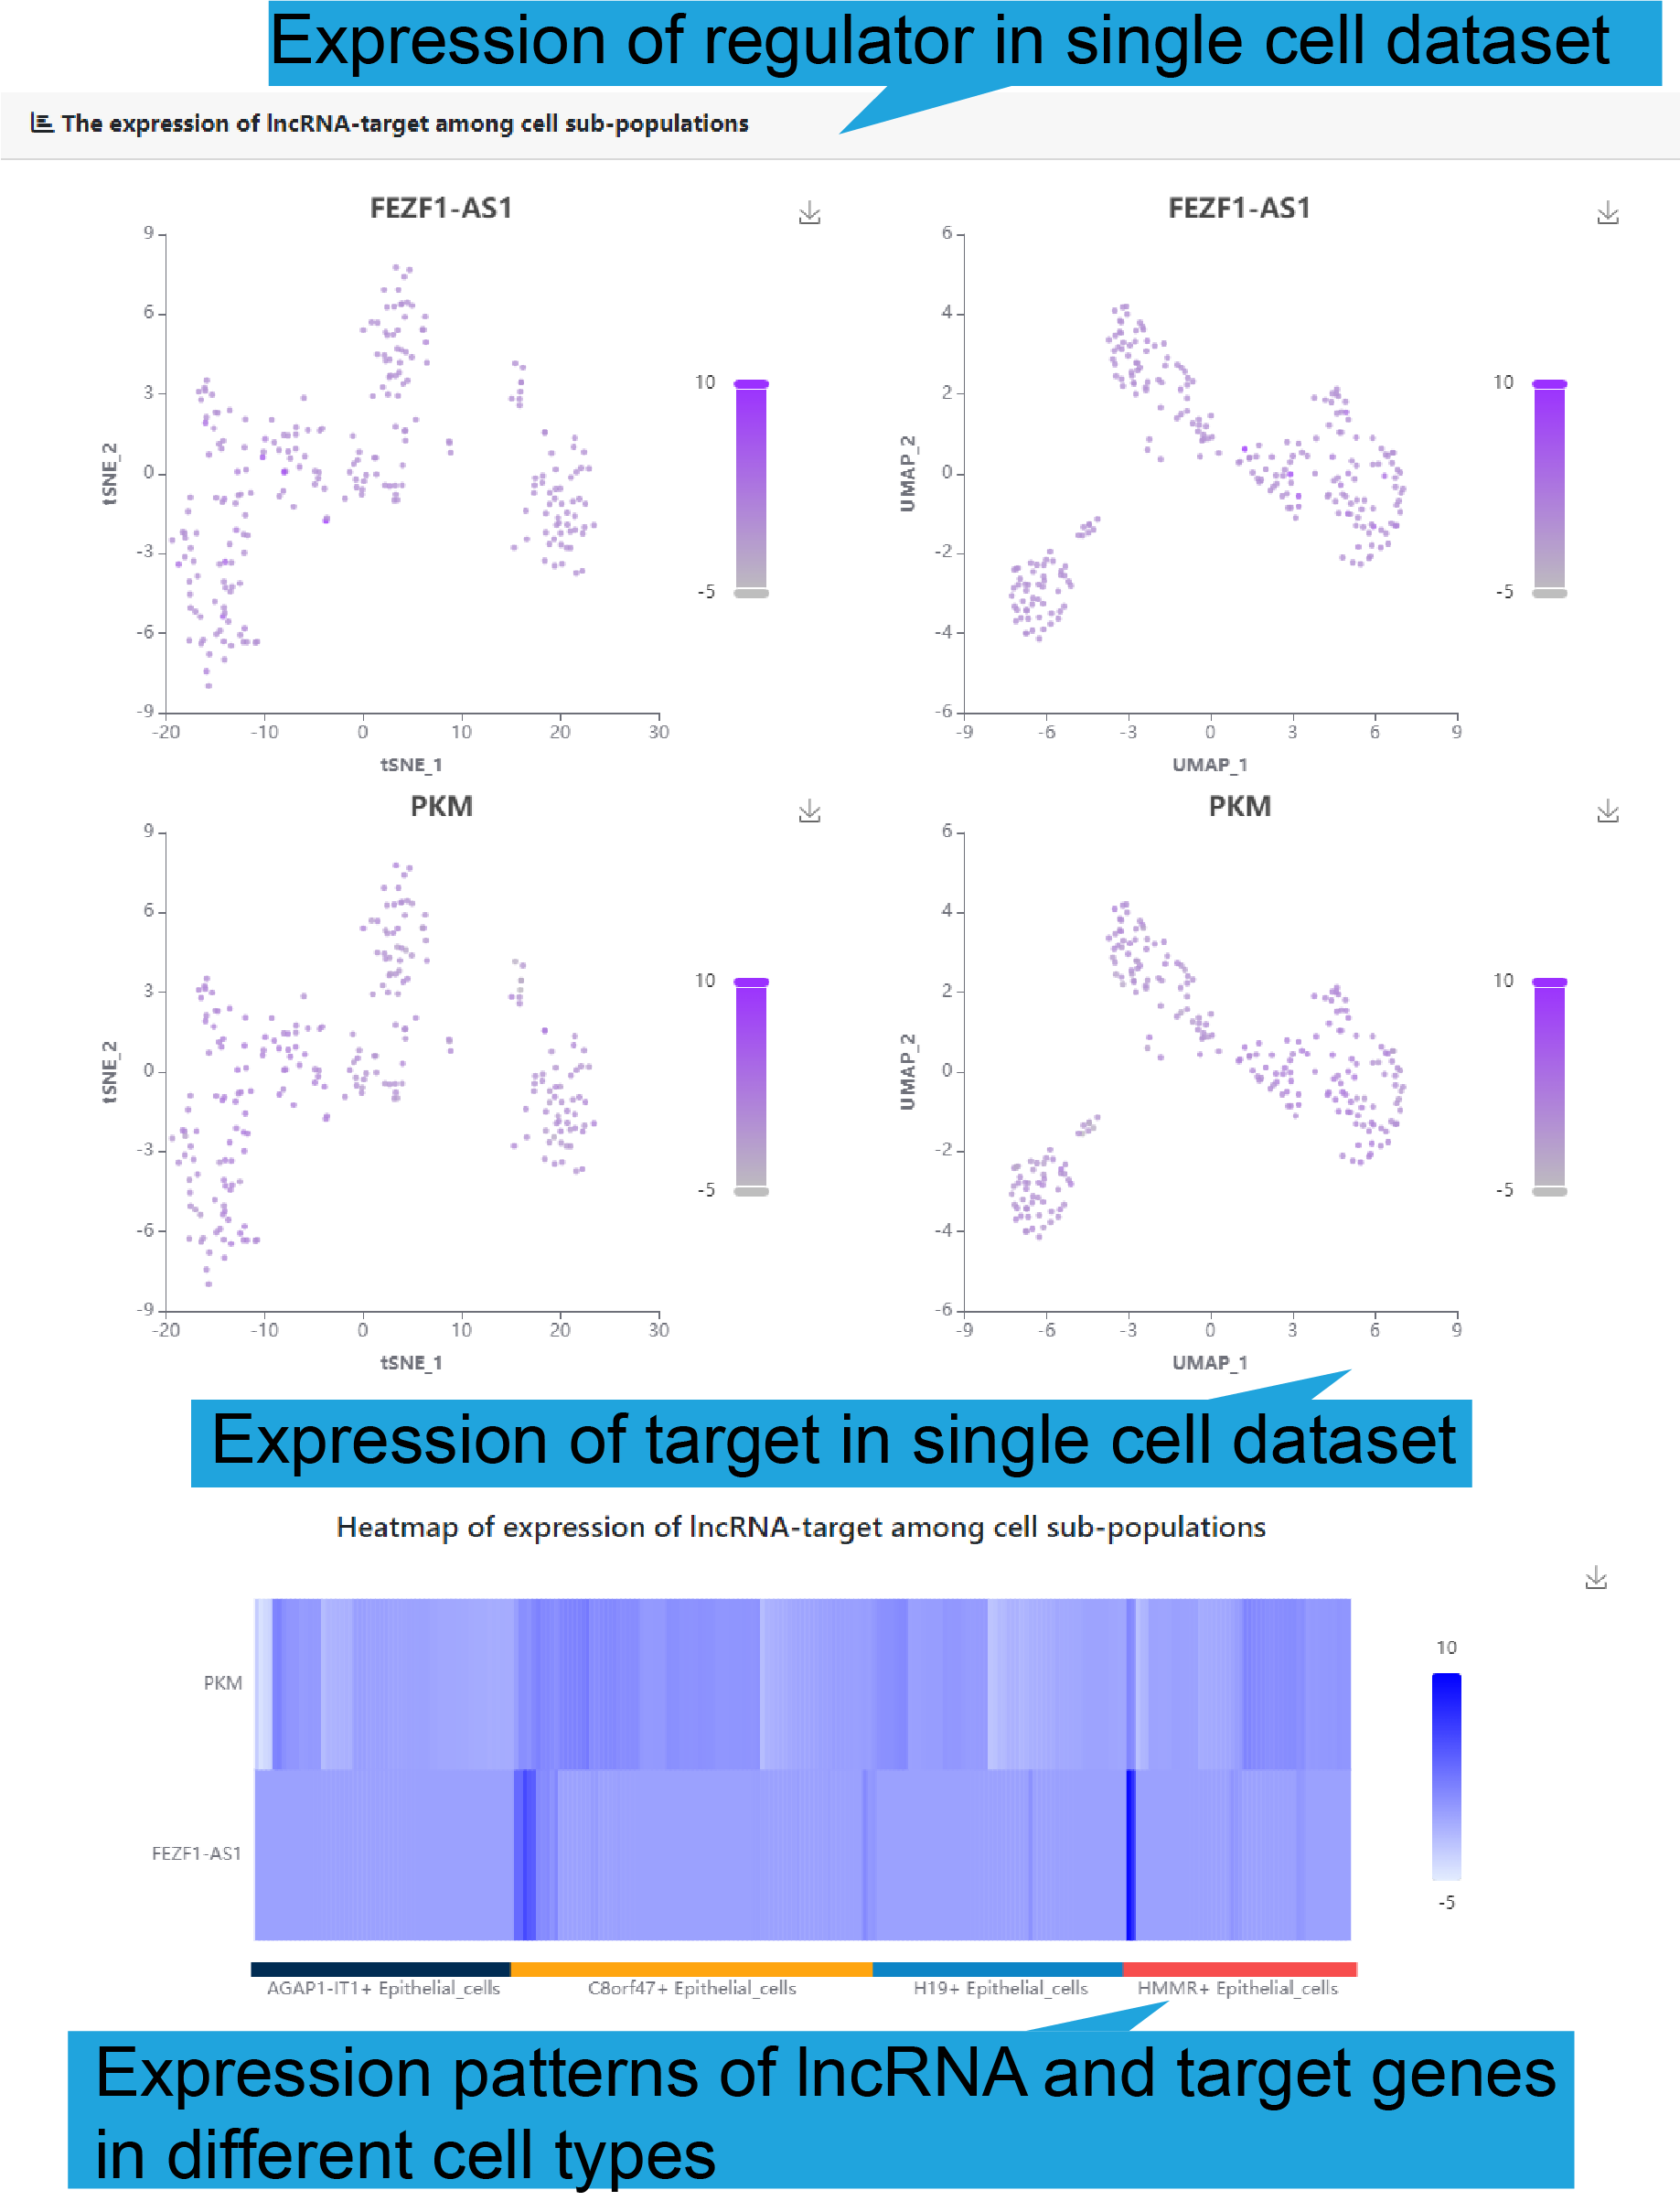
Sub-populations of cells identified in different single-cell datasets
To demonstrate the expression of the functional lncRNA-target regulation in
singlecell
data, tSNE and UMAP were first used to reduce dimension of single-cell data and
identify
cell types (as figure below shows). Cell types are distinguished by color, and the
legend illustrations indicate the most specific genes and selected data sets for
each
cancer cell type.
Gene expression level in different cell subtypes of the functional lncRNA-target
regulation based on single cell dataset was shown if available.
The figure below shows the normalized expression levels of genes in each cell.
Differential expression analysis of lncRNA-target regulation among different cell
sub-populations
The boxplot shows the expression distribution of genes (as figure below shows),
Statistical analyses were using wilcoxon rank sum test.
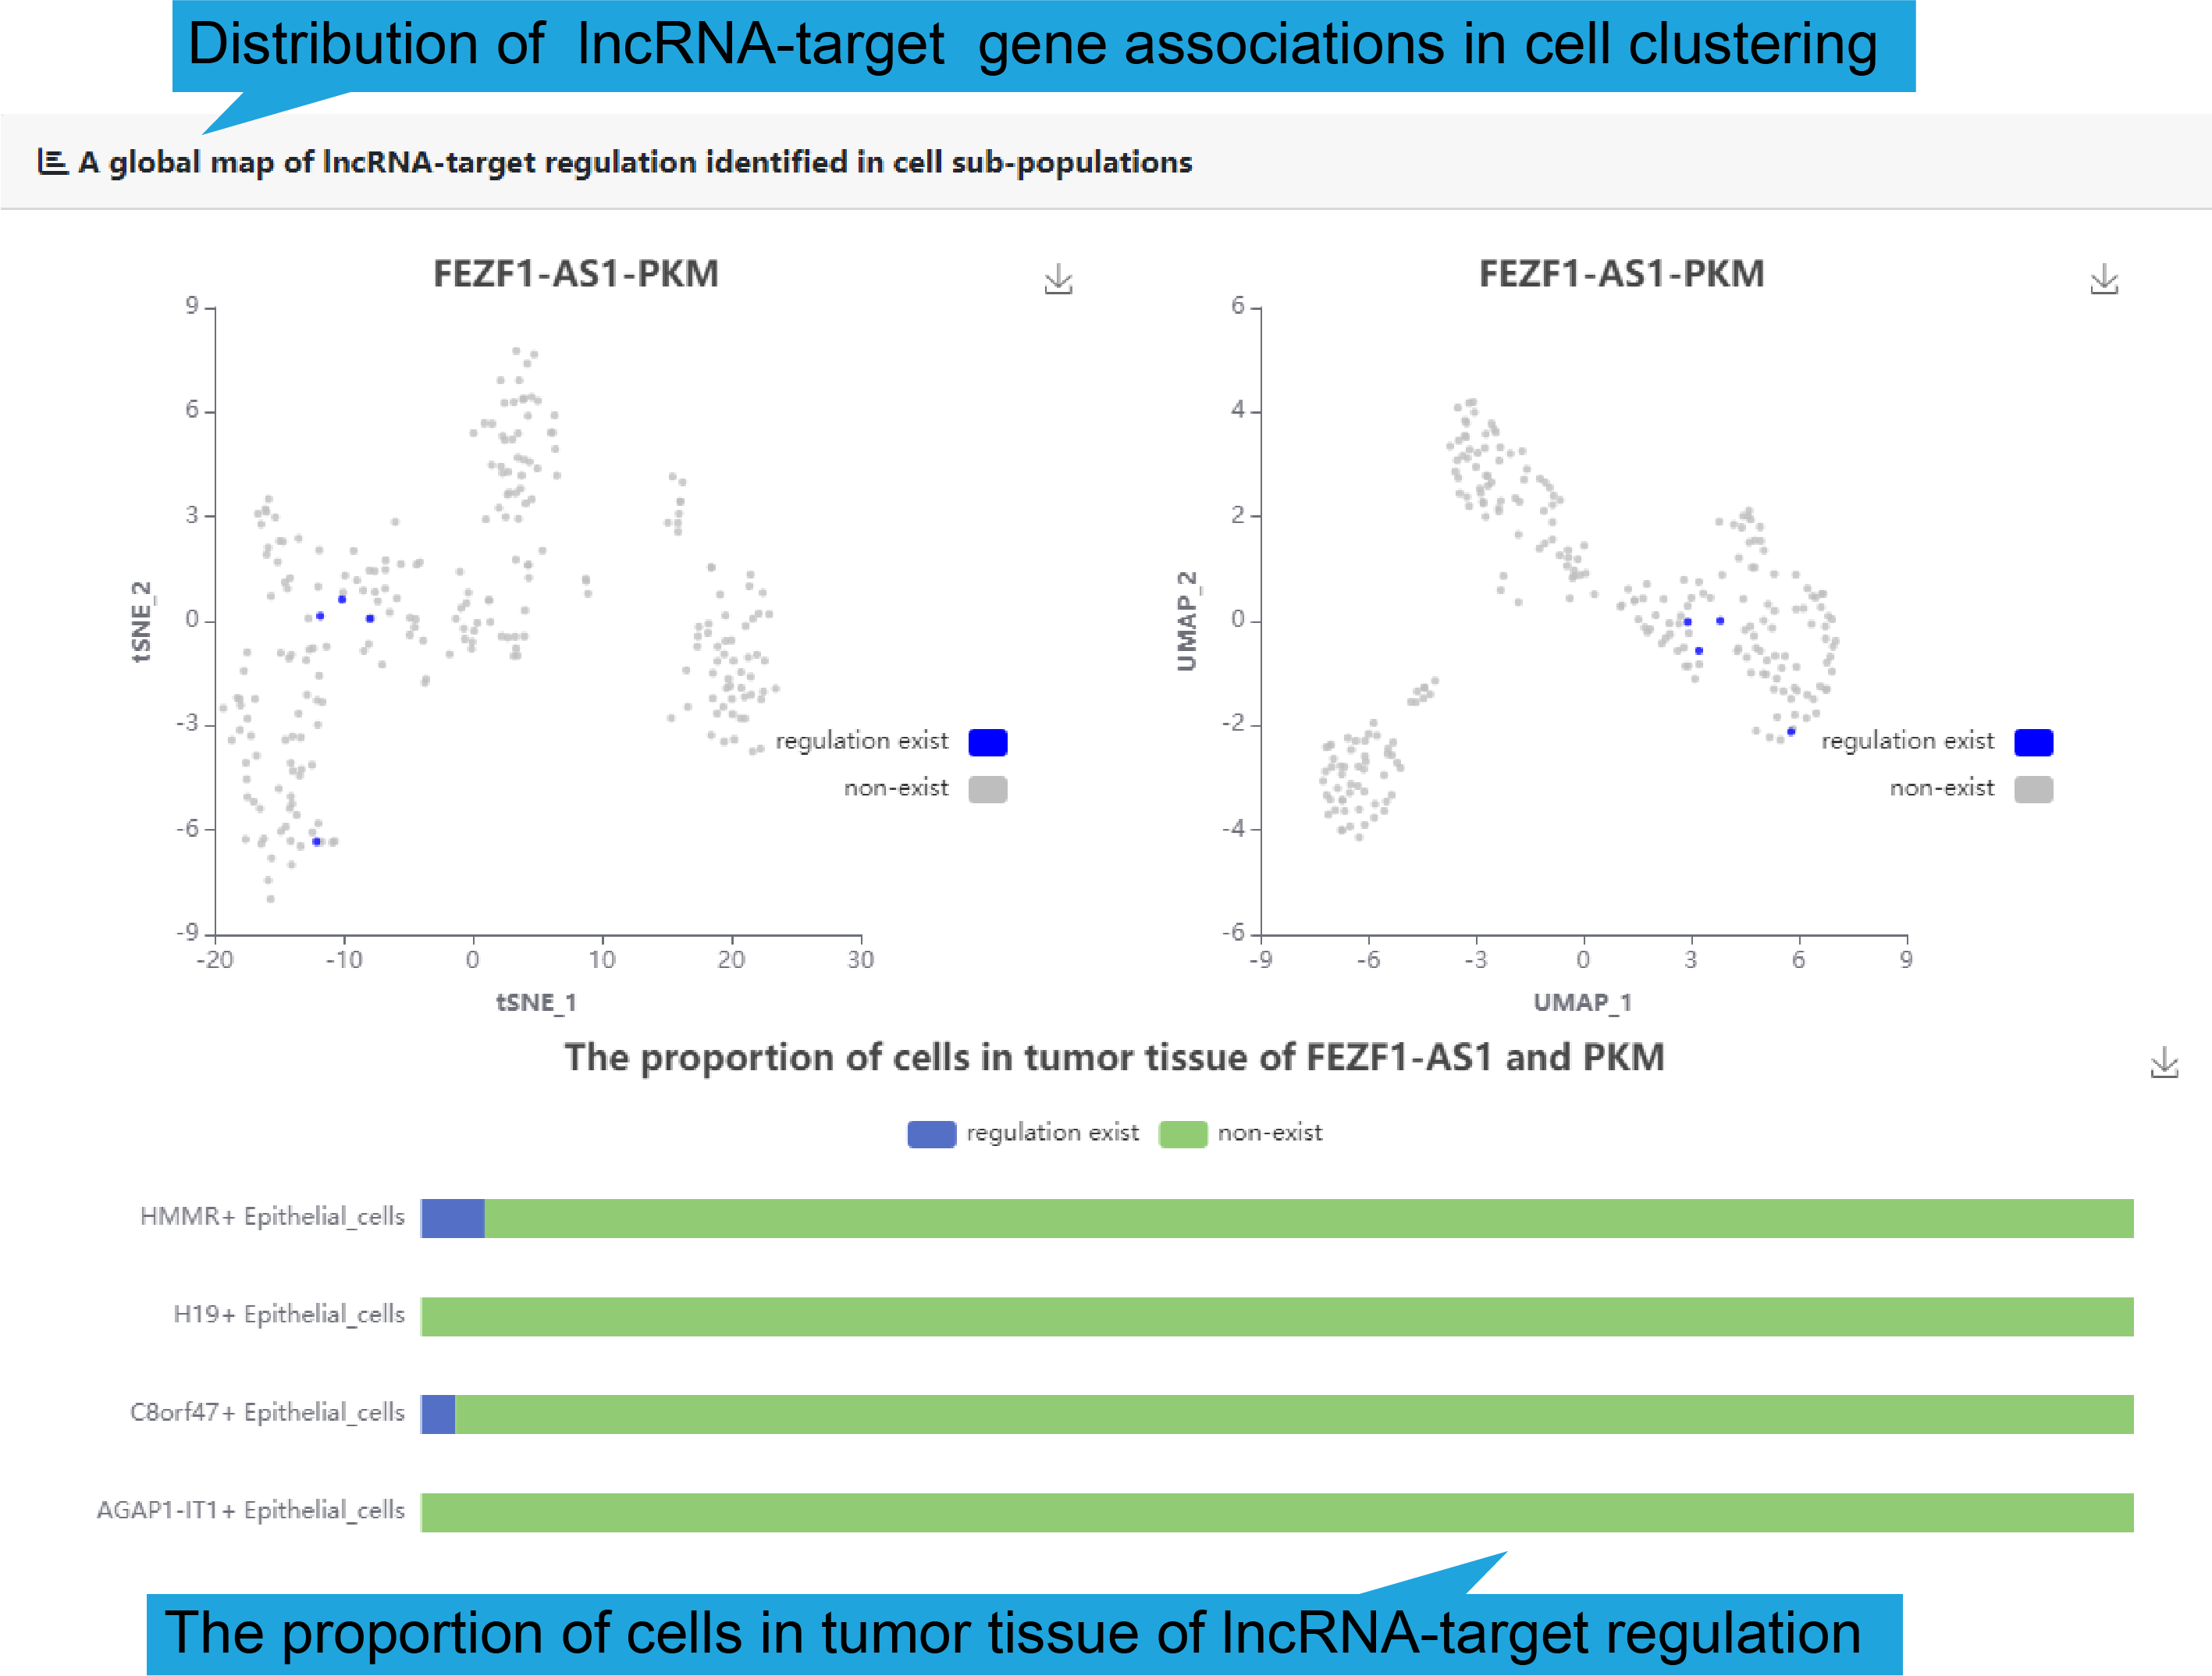
The distribution of lncRNA-target gene associations in cell sub-populations was
demonstrated
In addition, to show the expression correlation of functional lncRNA-target
regulations
in human disease, gene association between lncRNA and key target in each of 50
single
cell datasets are shown. And the bar plot shows the proportion of expression
correlation
in different cell types.
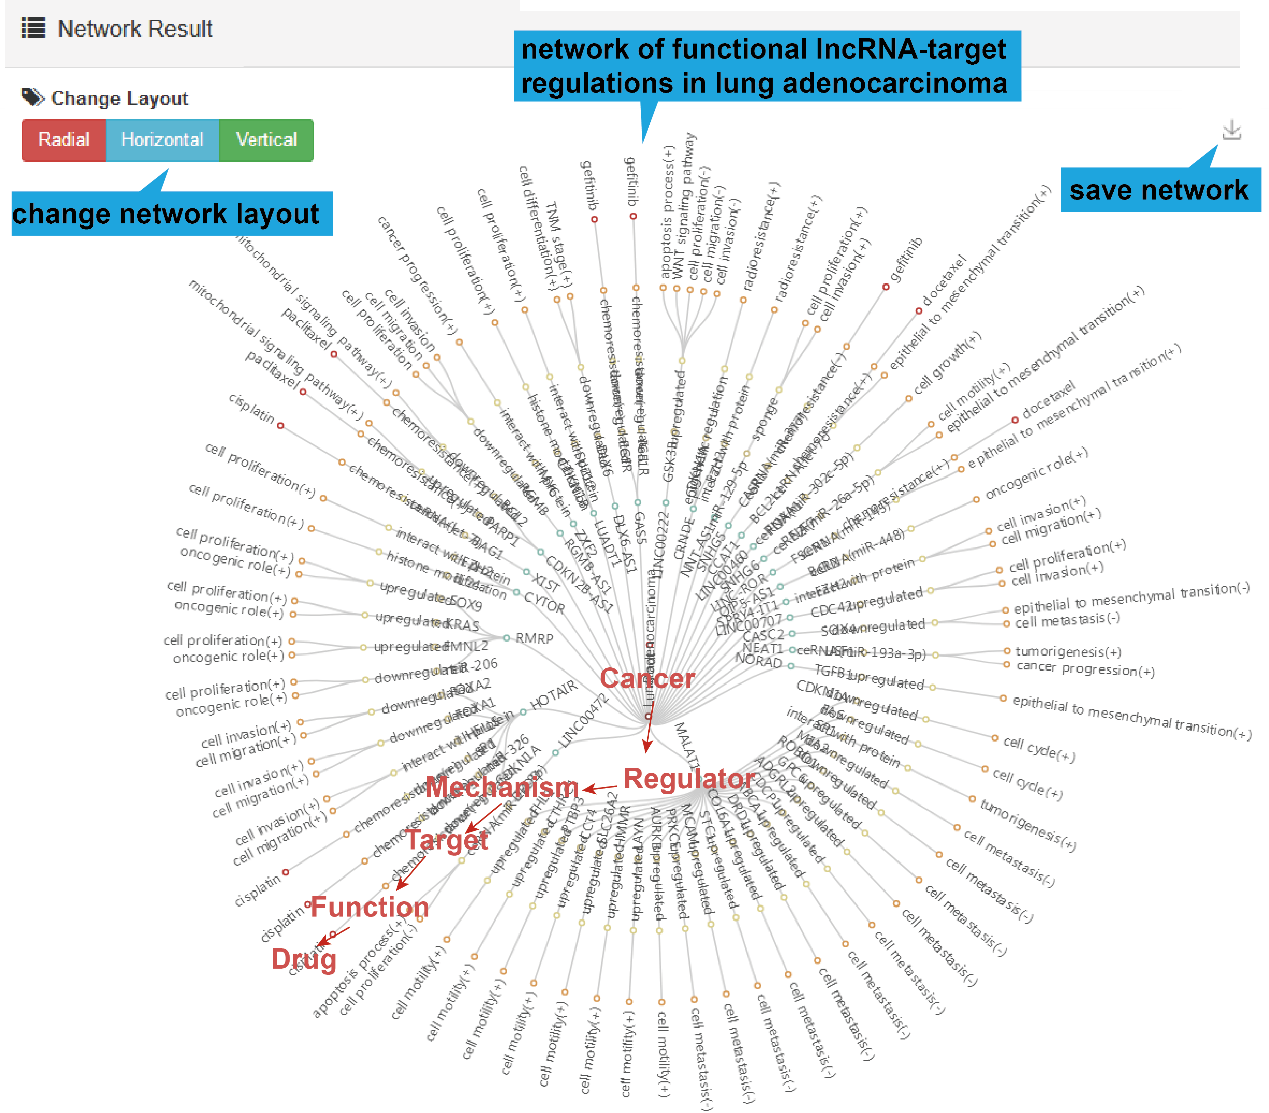
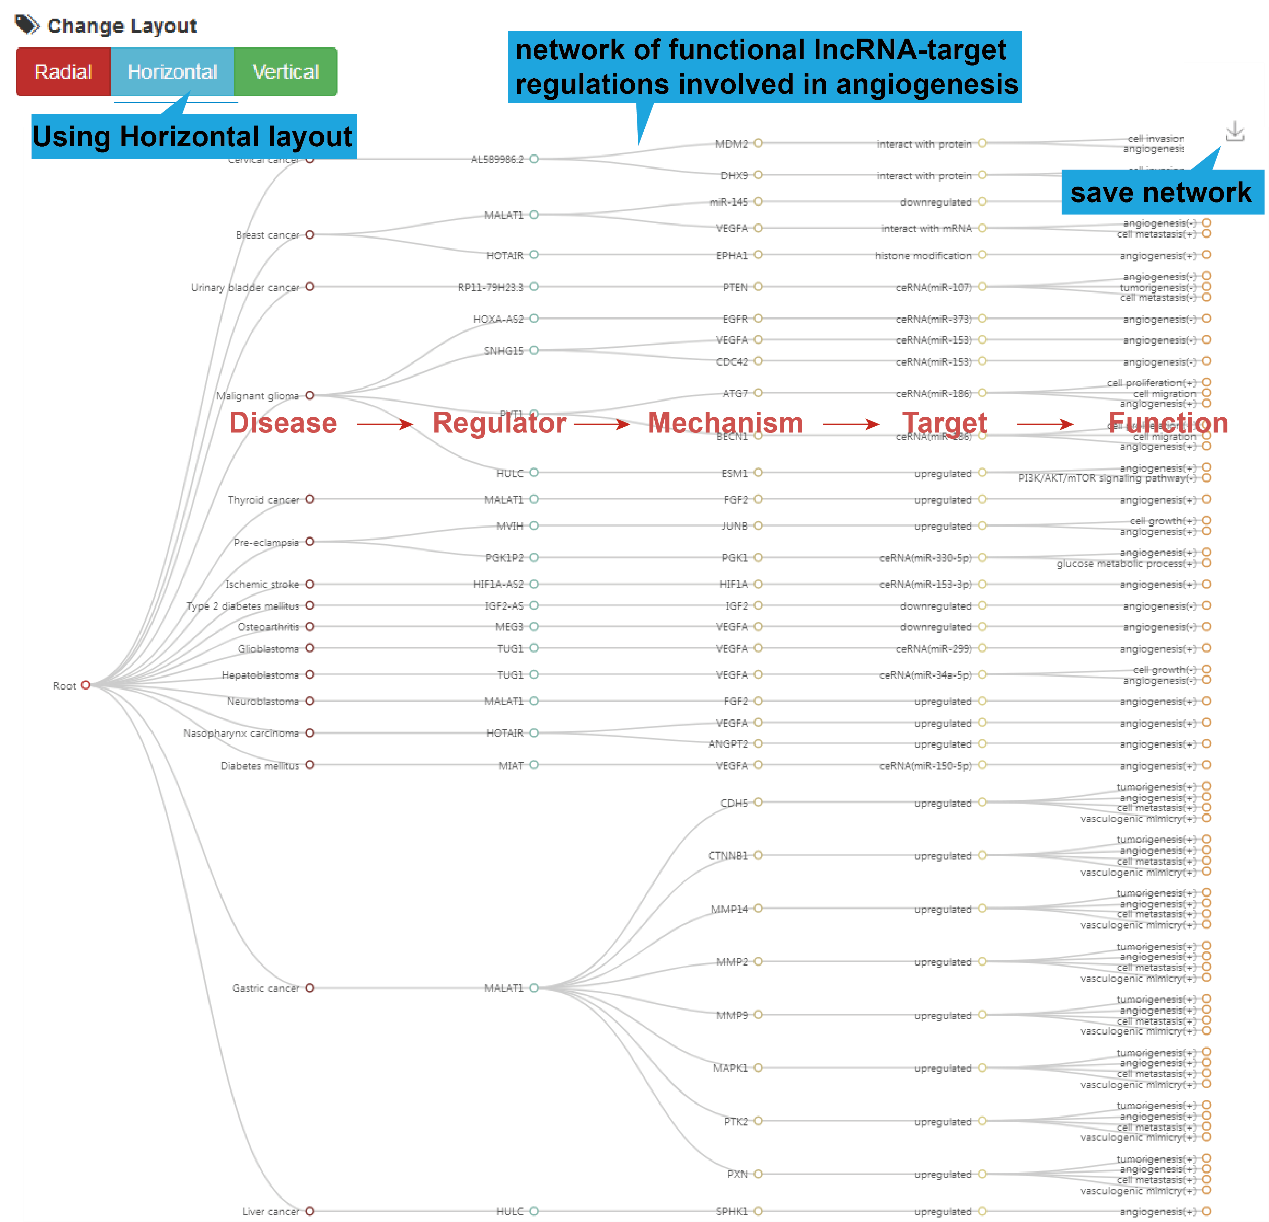
4).Network Result
At the bottom of the table, users can show the functional lncRNA-target network
based on
the table contents by clicking the "Network Display" button.
2.Differential expression page:
1).Search bar:
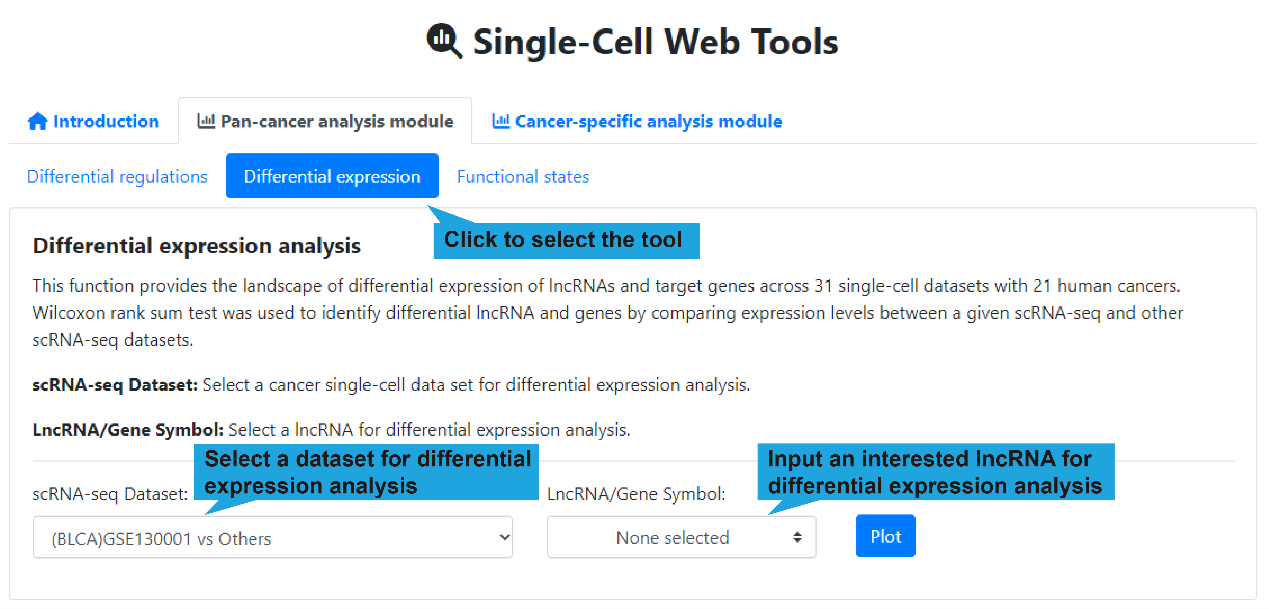
This function allows users to obtain differential expression information of lncRNAs and
target gene in 31 single-cell datasets. Wilcoxon rank sum test was used to identify
differential lncRNA and genes by comparing expression levels between a given single-cell
scRNA-seq and other scRNA-seq datasets.
Users first select “Pan-cancer analysis module”, followed by “Differential expression”,
then select a cancer single-cell dataset and input an interested lncRNA name , after
that click the “Plot” button to retrieve the landscape of differential expression of
lncRNAs and target genes. If no interested lncRNA is inputted, all landscape of
differential expression between a given single-cell scRNA-seq and other scRNA-seq
datasets are displayed.
scRNA-seq Dataset: Select a cancer single-cell dataset for differential
expression analysis.
LncRNA/Gene Symbol: Select a lncRNA for differential expression analysis.
(optional)
2).Differential expression in cells across single-cell datasets
We provide heatmap of differential expressed lncRNAs among diverse cell population in 31
single-cell datasets are displayed. Users can select a cancer single-cell dataset for
differential expression analysis.
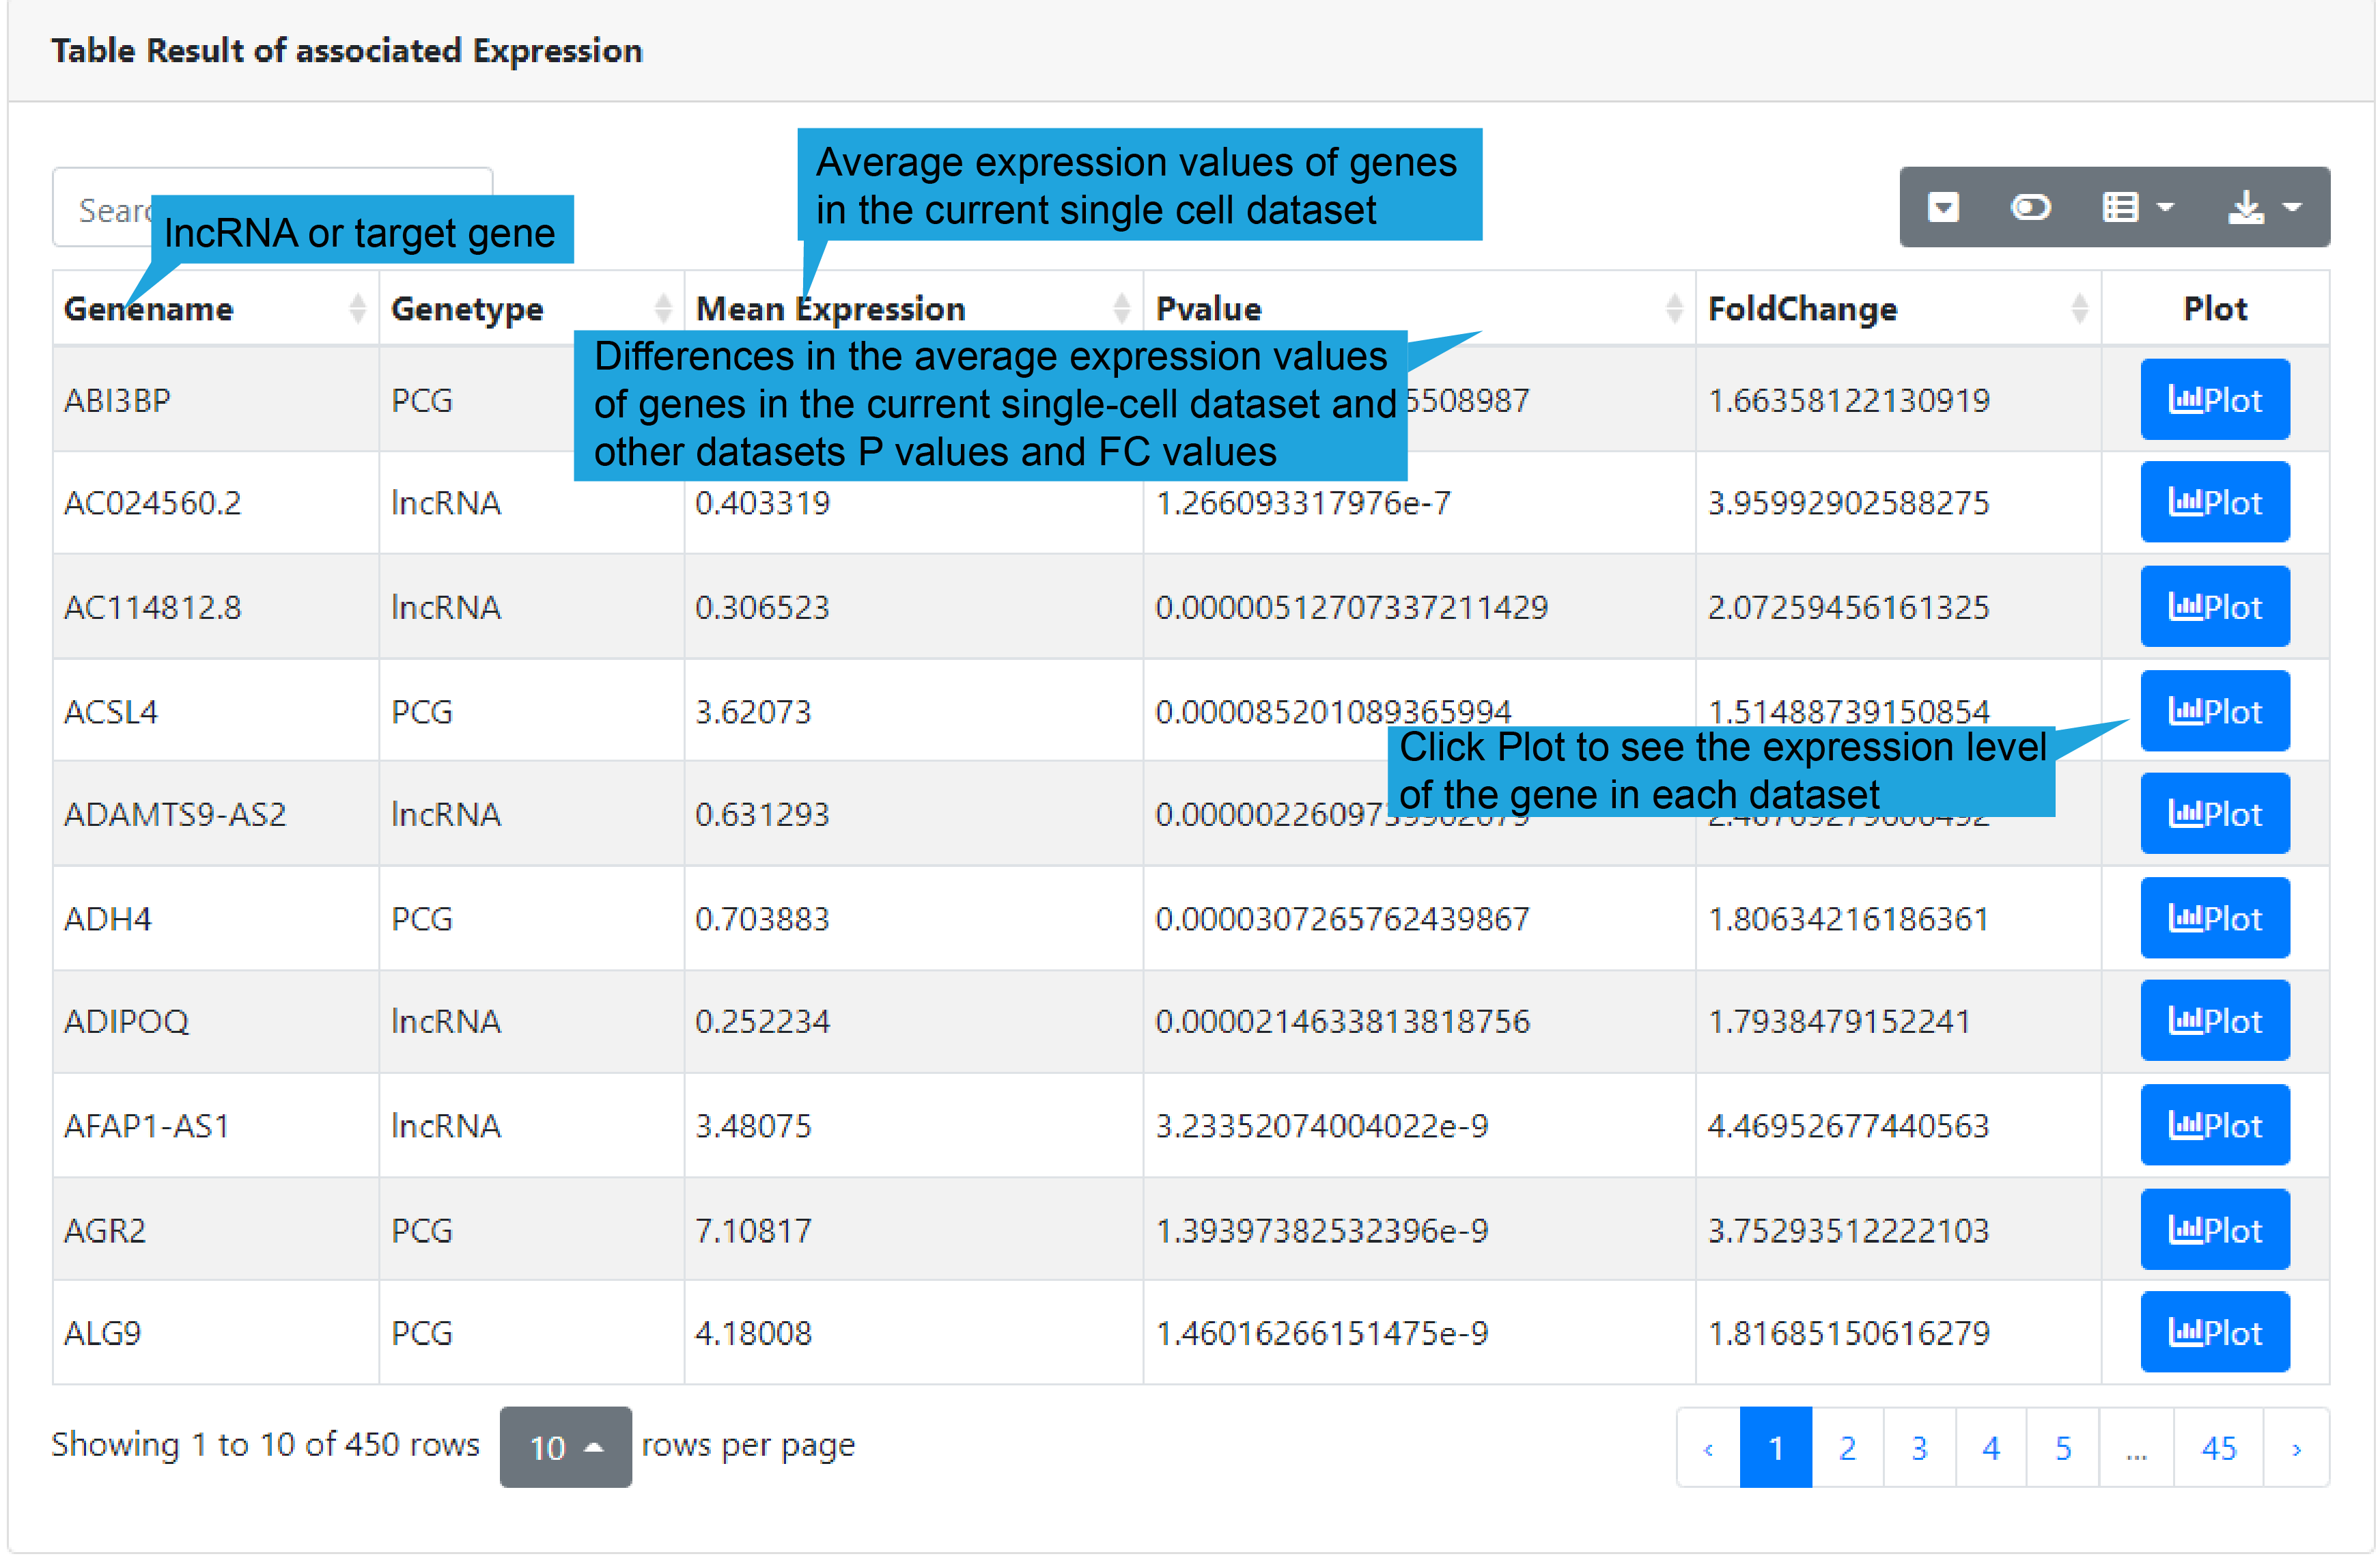
3).Search result table
We provide a table with a gene record in each row, including gene name, gene type,
average expression value, differential P-value, and FC value. Users can click “Plot” to
see the expression level of the gene in each dataset.
4).differential expression of lncRNA-target in single cell datasets
The boxplot shows the differential expression levels of gene in 31 single-cell datasets.
At the same time, we provided a table to show all lncRNA-target regulations of the
selected gene. Users can click “Web Tools” to get more lncRNA and target analysis tools
or “More Details” to get more detailed information. In addition, users can click
"Network Display" to show the functional lncRNA-target network.
3.Functional states page:
1).Search bar:
This function provides the landscape of the proportion of cells with high activity
scores (> 0.5*max (AUC scores)) for differential lncRNA-target regulations associated
with a given cell state (such as stemness, epithelial-mesenchymal transition,
angiogenesis and inflammation) across 31 single-cell datasets with 21 human cancers.
Wilcoxon rank sum test was used to identify differential lncRNA-target regulations by
comparing the activity scores between a given cell functional state and other cell
functional states.
Users first select “Pan-cancer analysis module”, followed by “Functional states”. Then
select a cell states, a cancer single-cell dataset and an interested lncRNA name, and
then click the “Plot” button to retrieve the landscape of differential lncRNA-target
regulations associated with a given cell state. If no interested lncRNA is inputted, all
landscape of differential lncRNA-target regulations between a given scRNA-seq dataset
and other scRNA-seq datasets are displayed.
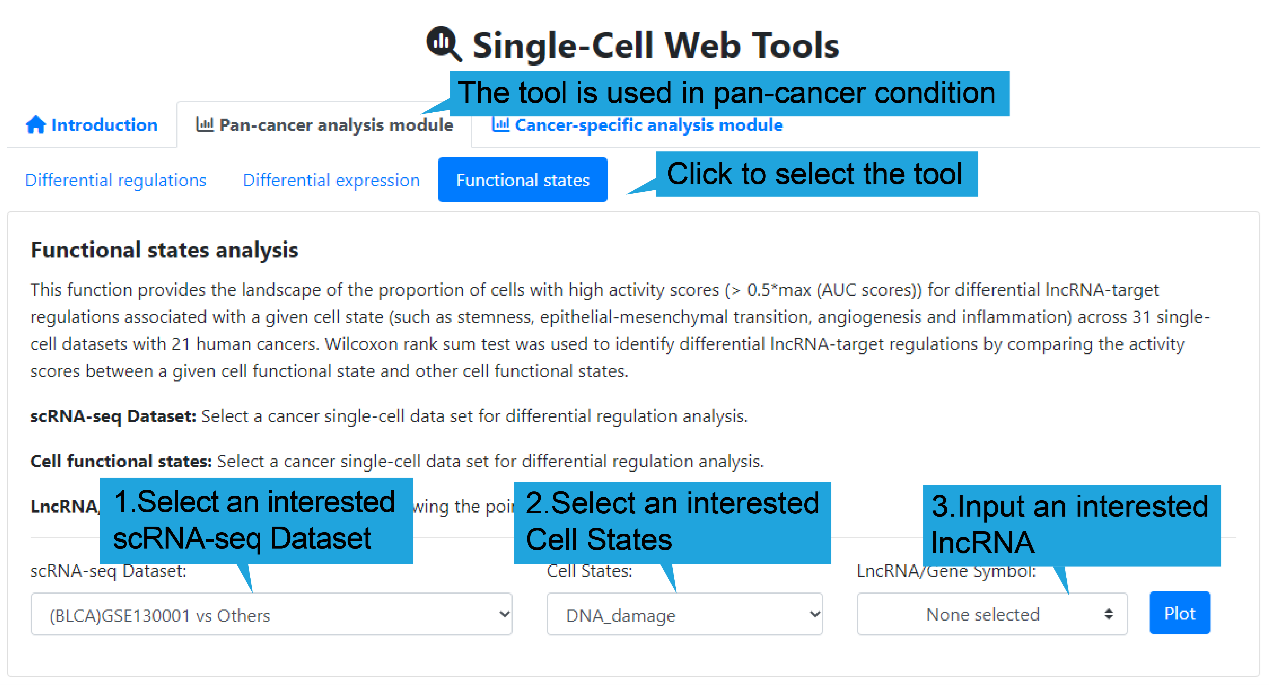
Select a cancer single-cell dataset for differential
regulation analysis.
Cell states: Select a cell functional state for analysis.
LncRNA/Gene Symbol: Select a lncRNA for drawing the point diagram.
(optional)
2).Differential regulations in cell status across single-cell datasets
The bubble triangle plot shows the percentage of the number of cells with lncRNA-target
regulation high activity scores between datasets for the selected cell state. (figure
below) To show the differential lncRNA-target regulations in different datasets under
the selected cell state, we used the same approach as 'Differential regulations',
including CSN, Wilcoxon rank sum test and AUCell. The results of differential expression
are shown in the table below.
3).Search result table
The table below shows the details of the searched lncRNA. We provided a table, with a
single association record on each line that contains disease name, lncRNA name, target
name, influenced biological functions and regulatory mechanism. Users can click “Web
Tools” to get more lncRNA and target analysis tools or “More Details” to get more
detailed information of the lncRNA-target regulation. In addition, users can click
"Network Display" to show the functional lncRNA-target network.
Cancer-specific analysis module of key lncRNA-target
1.Differential regulations page:
1).Search bar:
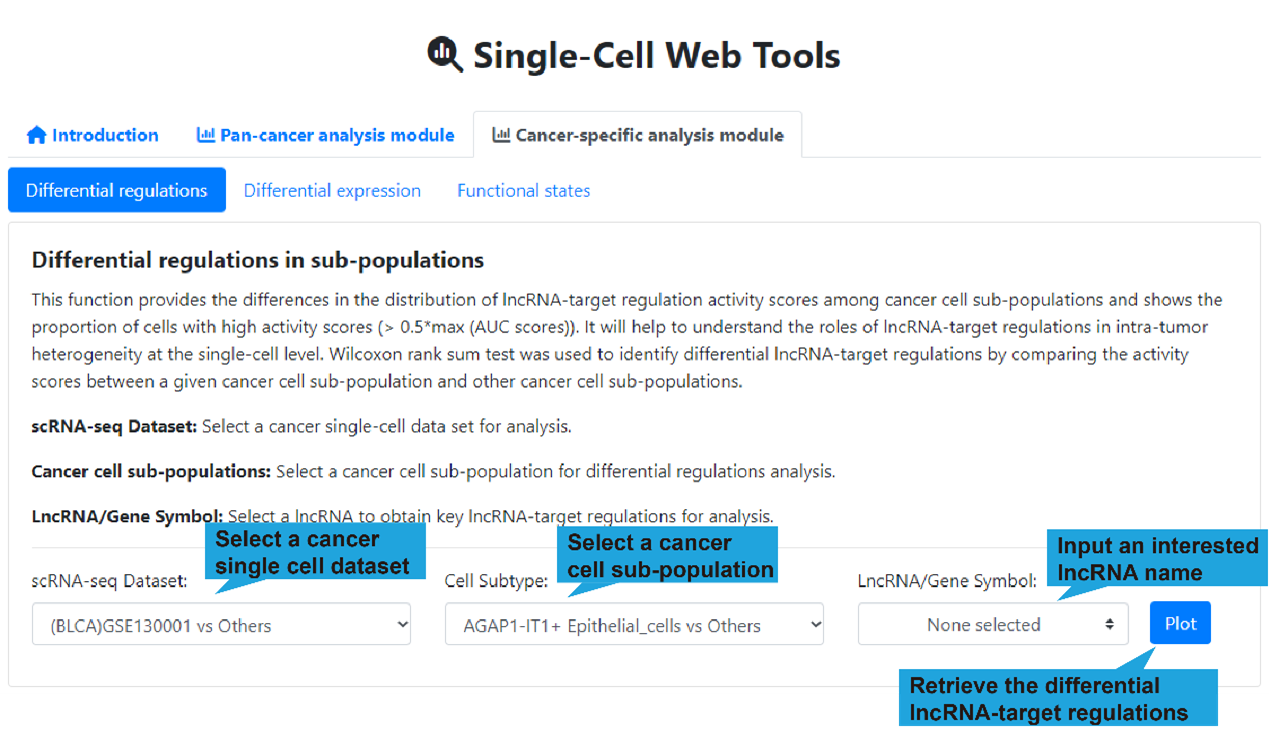
This function provides the differences in the distribution of lncRNA-target regulation
activity scores among cancer cell sub-populations and shows the proportion of cells with
high activity scores (> 0.5*max (AUC scores)). It will help to understand the roles
of
lncRNA-target regulations in intra-tumor heterogeneity at the single-cell level. To
analyze the distribution difference, you should select a cancer single-cell dataset, a
cancer cell sub-population and an interested lncRNA first, and then click the “Plot”
button. If no interested lncRNA is inputted, all differential lncRNA-target regulations
between a given cancer cell sub-population and other cancer cell sub-populations are
displayed.
scRNA-seq Dataset: Select a cancer single-cell dataset for analysis.
Cell Subtype: Select a cancer cell sub-population for differential regulations
analysis.
LncRNA/Gene Symbol: Select a lncRNA to obtain key lncRNA-target regulations for
analysis. (optional)
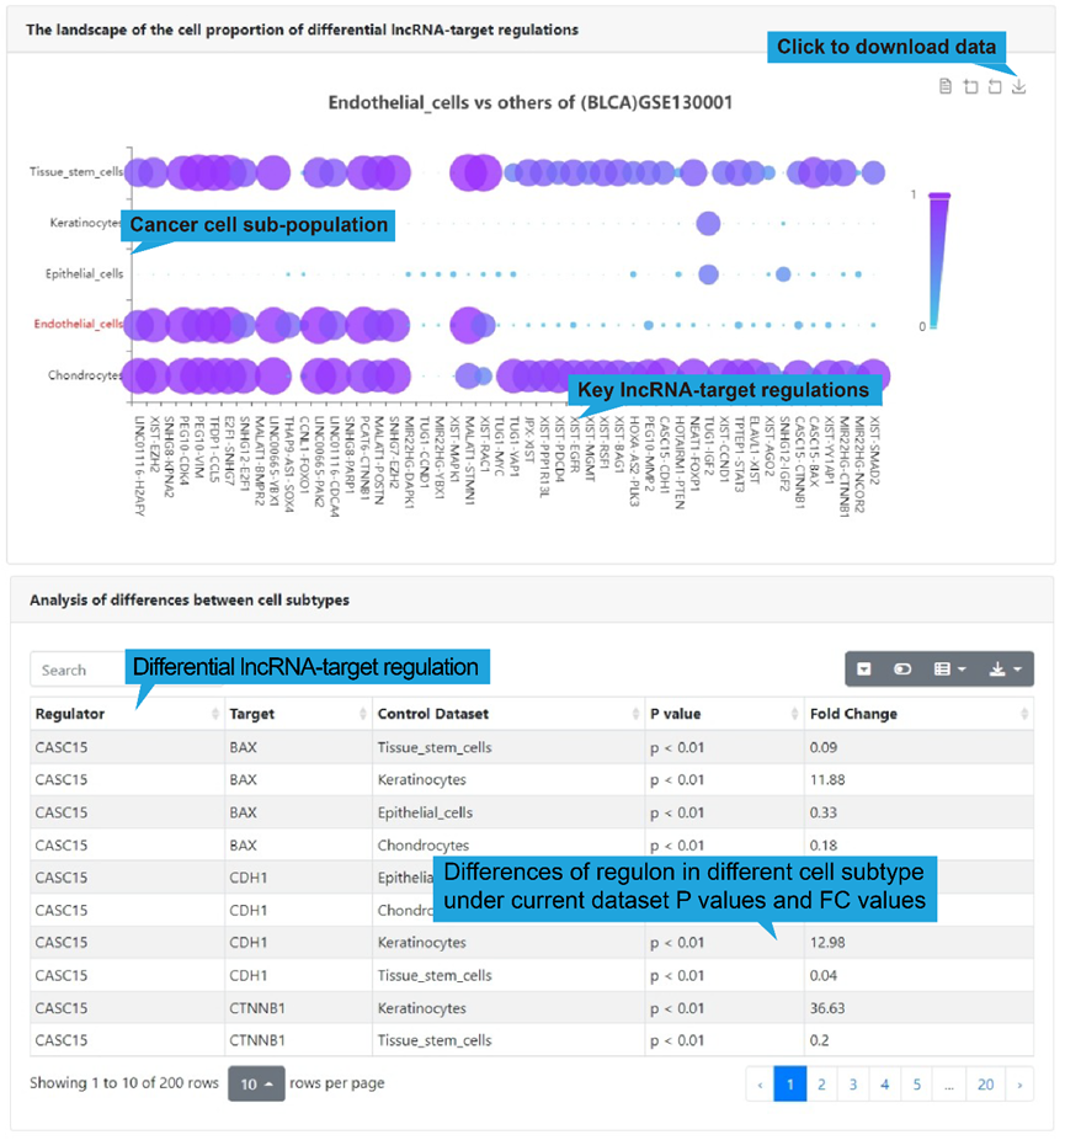
2).Differential regulations in cell sub-populations
The dot plot shown below presents top differential regulations for the selected cell
sub-populations in the selected dataset. (figure below) To show the differential
lncRNA-target regulations in different cell sub-populations, we used the same approach
as 'Differential regulations', including CSN, Wilcoxon rank sum test and AUCell. The
results of differential expression are shown in the table below.
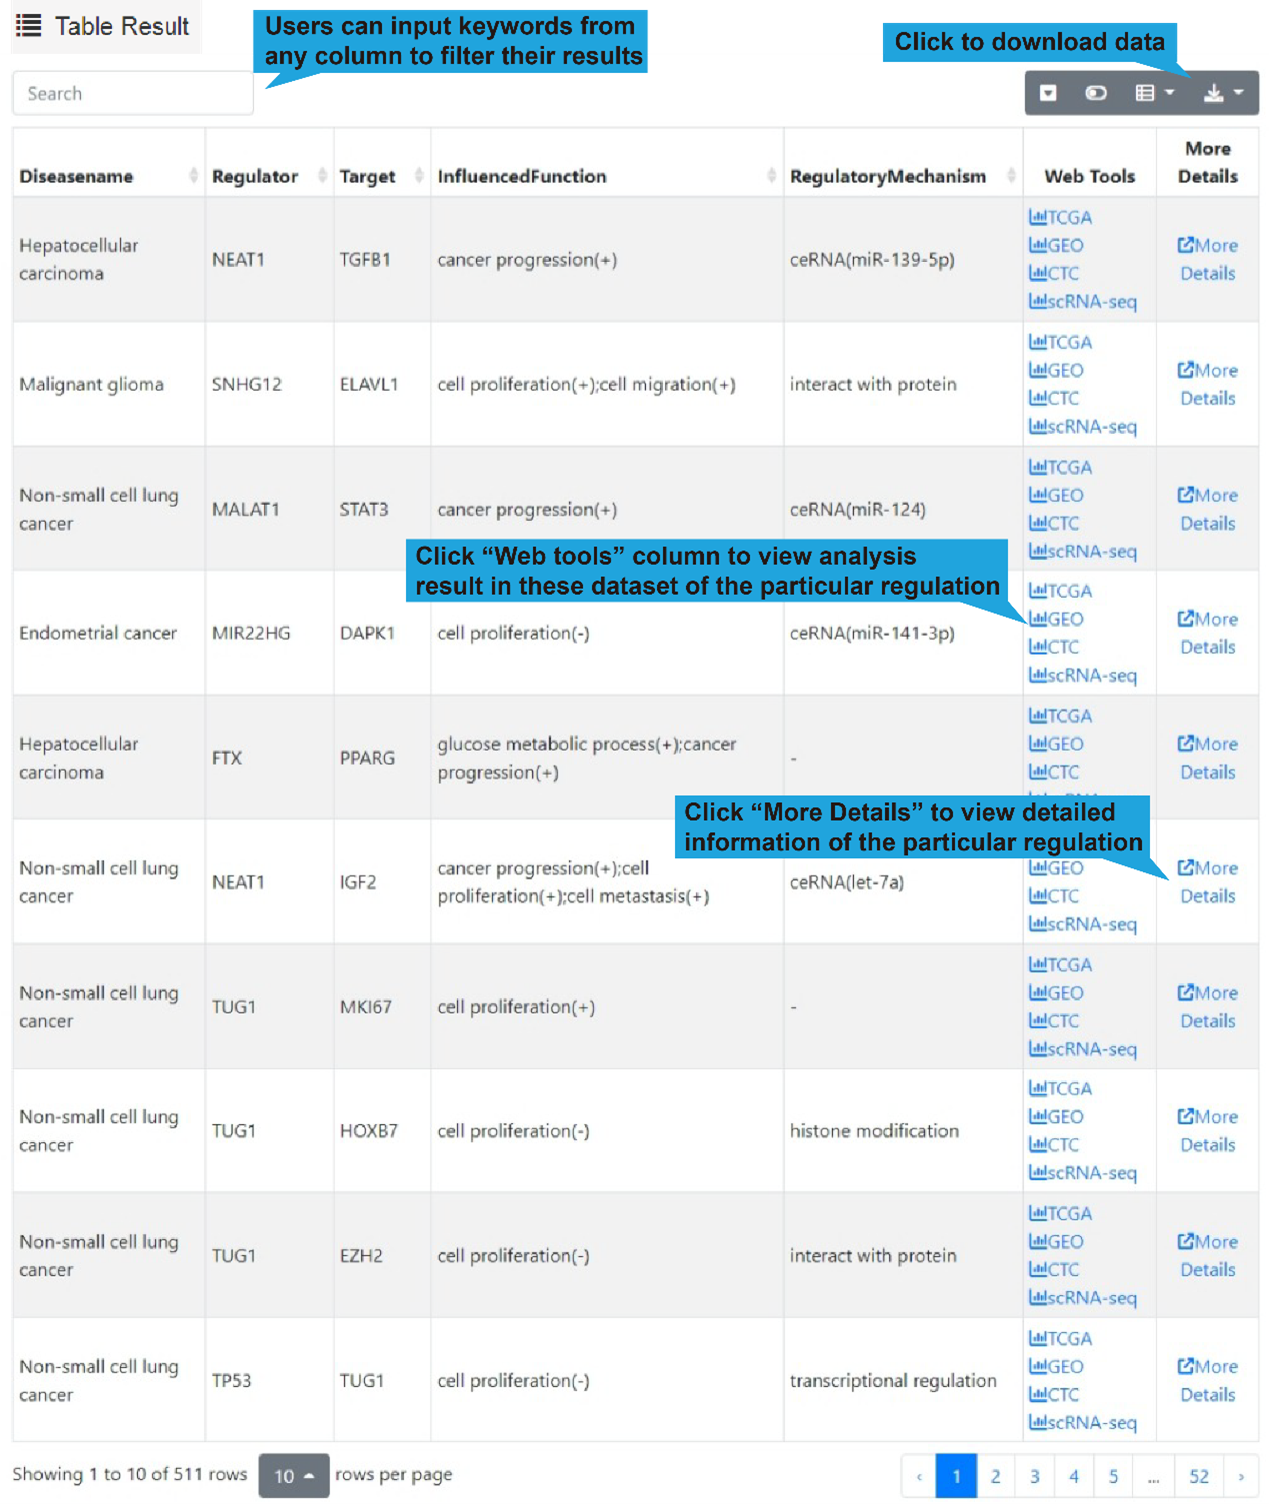
3).Search result table
All differential lncRNA-target regulations for the selected cell sub-populations in the
select single-cell dataset are listed in a table below the dot plot, with each
lncRNA-target regulation in one row, including disease name, lncRNA name, target name,
influenced biological functions and regulatory mechanism. Users can click “Web Tools”
column to get lncRNA and target analysis tools. Use the search box in the upper left
corner to quickly retrieve items of interest. Use the buttons in the upper right corner
to reformat the table and export data.
A detailed explanation of each item in the table is provided in '5. Search/Browse result
table' or 'Differential regulations'.
4).Network result
At the bottom of the table, users can show the functional lncRNA-target network based on
the table contents by clicking the "Network Display" button.
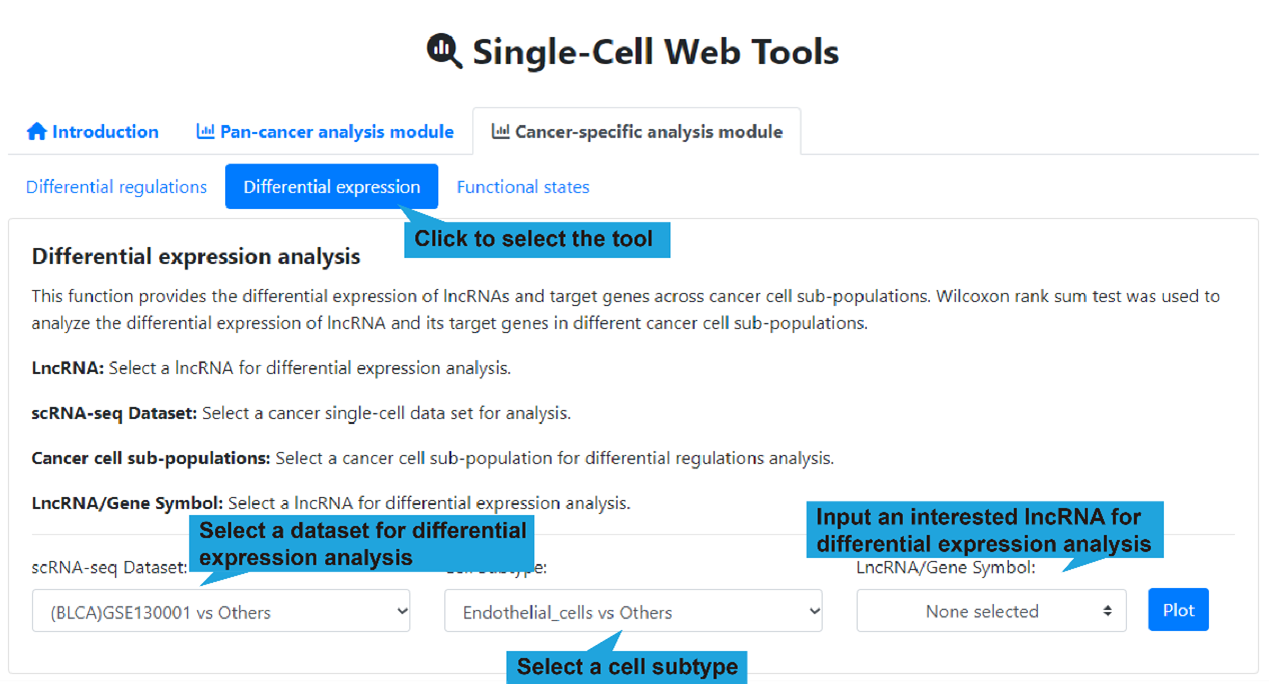
2.Differential expression page:
1).Search bar:
This function allows users to obtain differential expression information of lncRNAs and
target gene in sub-populations. Wilcoxon rank sum test was used to identify differential
lncRNA and target genes by comparing expression levels in different cancer cell
sub-populations.
Users first selects “Cancer-specific analysis” module, followed by “Differential
expression”, after that input a cancer single-cell dataset, a cell subtype and an
interested lncRNA, and then click the “Plot” button to retrieve the differential
expression of lncRNAs and target genes across cancer cell sub-populations. If no
interested lncRNA is inputted, all landscape of differential expression between
different cancer cell sub-populations are displayed.
scRNA-seq Dataset: Select a cancer single-cell dataset for analysis.
Cell Subtype: Select a cancer cell sub-population for differential regulations
analysis.
LncRNA/Gene Symbol: Select a lncRNA for differential expression analysis.
(optional)
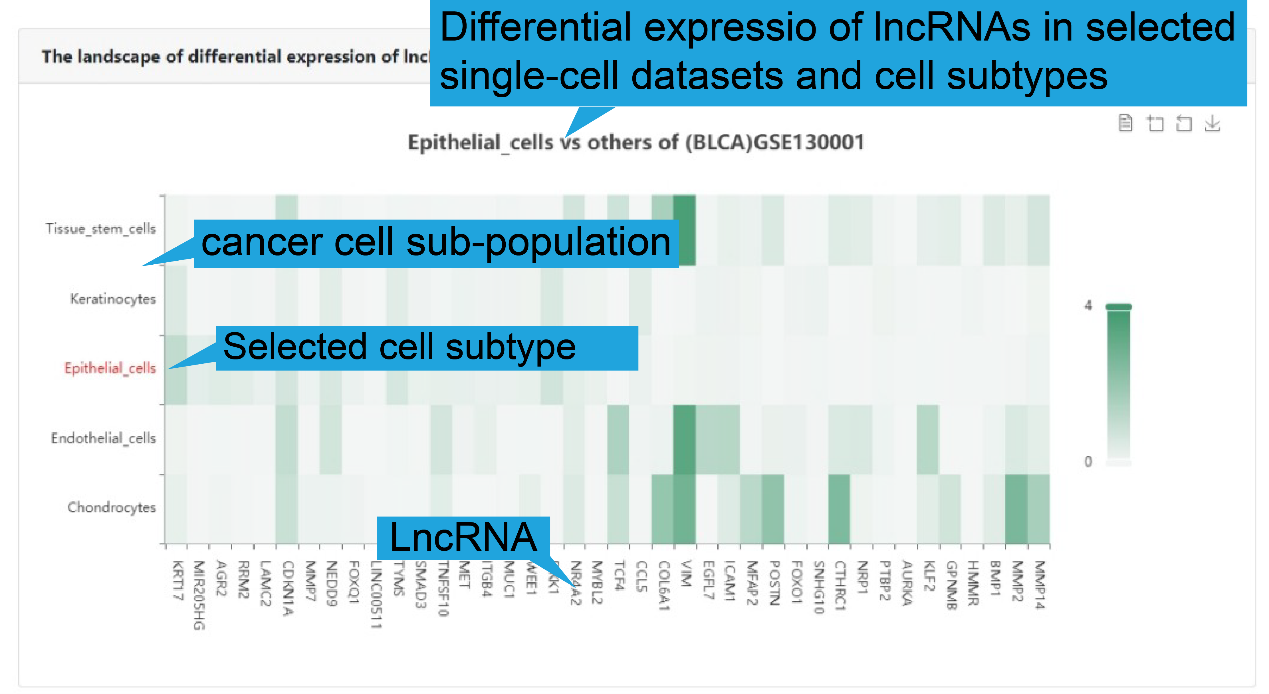
2).Differential expression in cell sub-populations
We provide heatmap of differential expressed lncRNAs among diverse cell population in
sub-populations is displayed. Users can select a lncRNA, a cancer single-cell datasets
or a cell subtype for differential expression analysis.
3).Search result table
We provide a table with a gene record in each row, including gene name, gene type,
average expression value, differential P-value, and FC value. Users can click “Plot” to
see the expression level of the gene in each cell subtype.
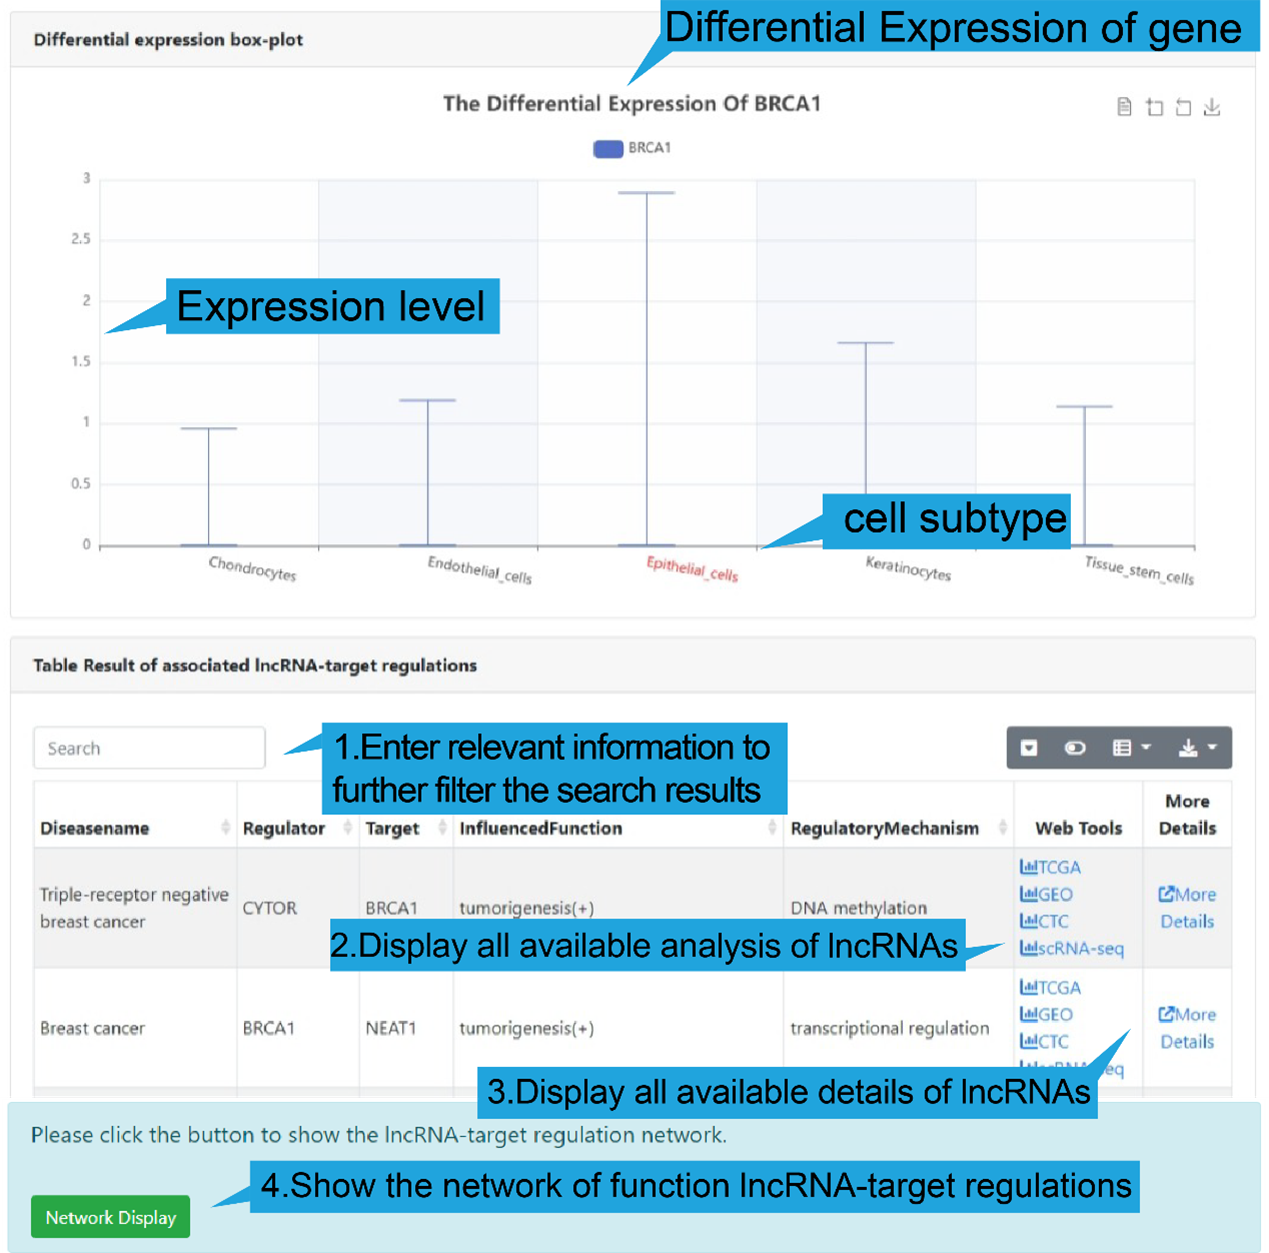
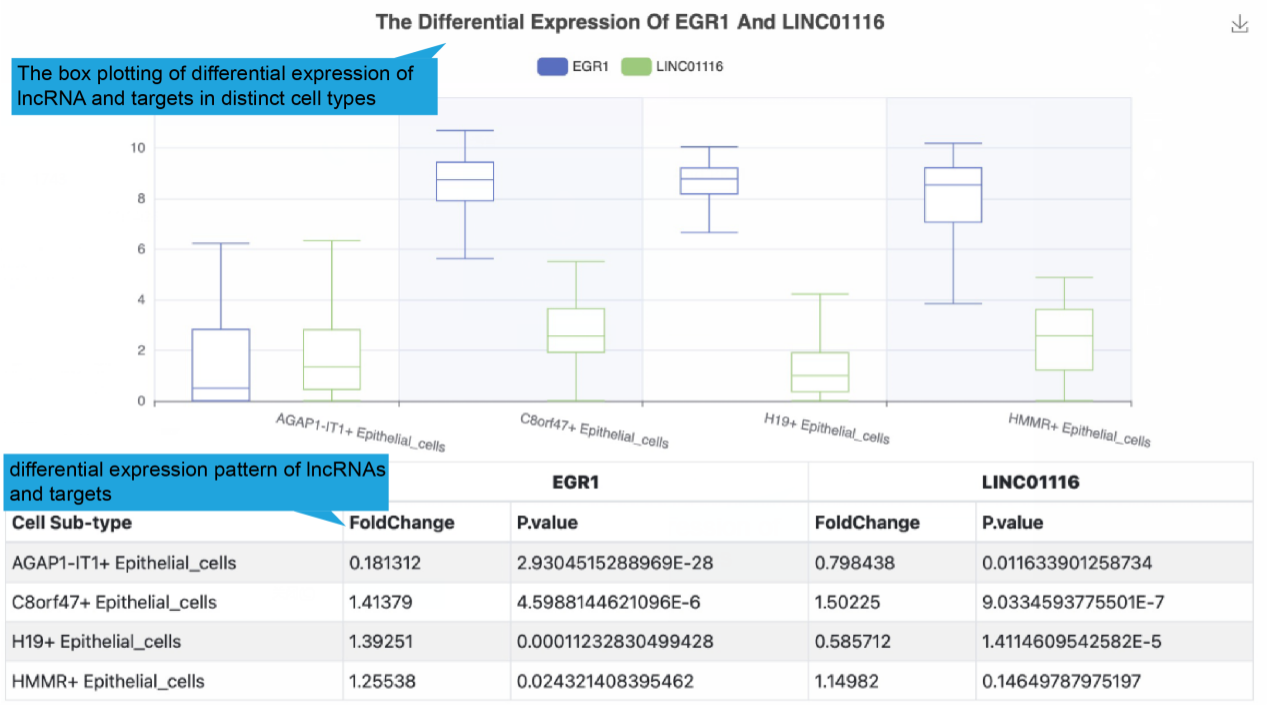
4).differential expression of lncRNA-target in cell sub-populations
The boxplot shows the differential expression levels of gene in each cell subtype in the
current dataset. At the same time, we provided a table to show all lncRNA-target
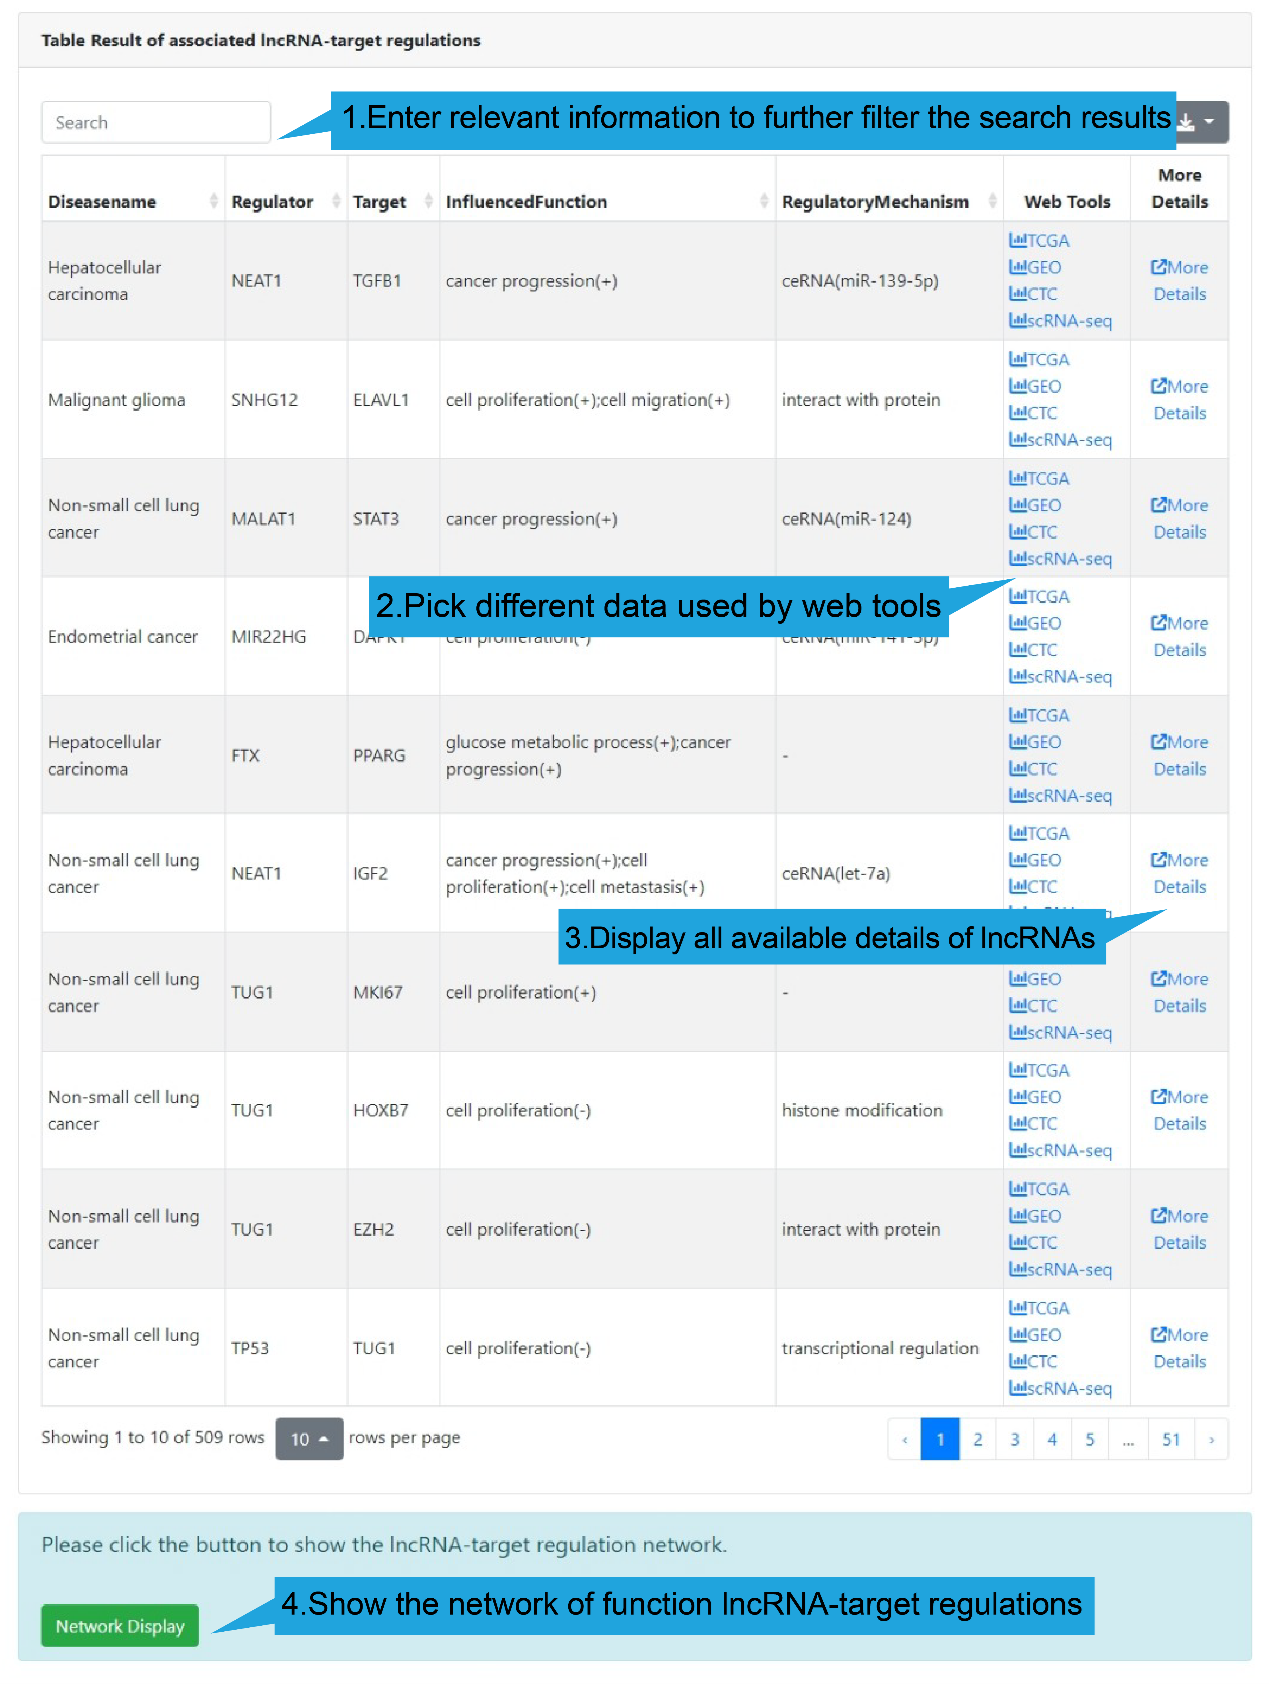
regulations of the selected gene. Users can filter the results using the search box in
the upper left corner (step 1 in figure below) or click “Web Tools” to get more lncRNA
and target analysis tools (step 2 in figure below) or “More Details” to get more
detailed information of the lncRNA-target regulation (step 3 in figure below). In
addition, users can click "Network Display" to show the functional lncRNA-target network
(step 4 in figure below).
3.Functional states page:
1).Search bar:
This function provides the cell proportion with high activity scores (> 0.5*max (AUC
scores)) of differential lncRNA-target regulations associated with a given cell state
(such as stemness, epithelial-mesenchymal transition, angiogenesis and inflammation)
among cancer cell sub-populations in a single-cell data sets. Wilcoxon rank sum test was
used to identify differential lncRNA-target regulations by comparing the activity scores
between a given cell functional state and other cell functional states.
Users first select “Cancer-special analysis module”, followed by “Functional states”.
Then select a cancer single-cell dataset, a cell states and an interested lncRNA name,
and then click the “Plot” button to retrieve the landscape of differential lncRNA-target
regulations associated with a given cell state. If no interested lncRNA is inputted, all
landscape of differential lncRNA-target regulations between a given cell functional
state and other cell functional states are displayed.
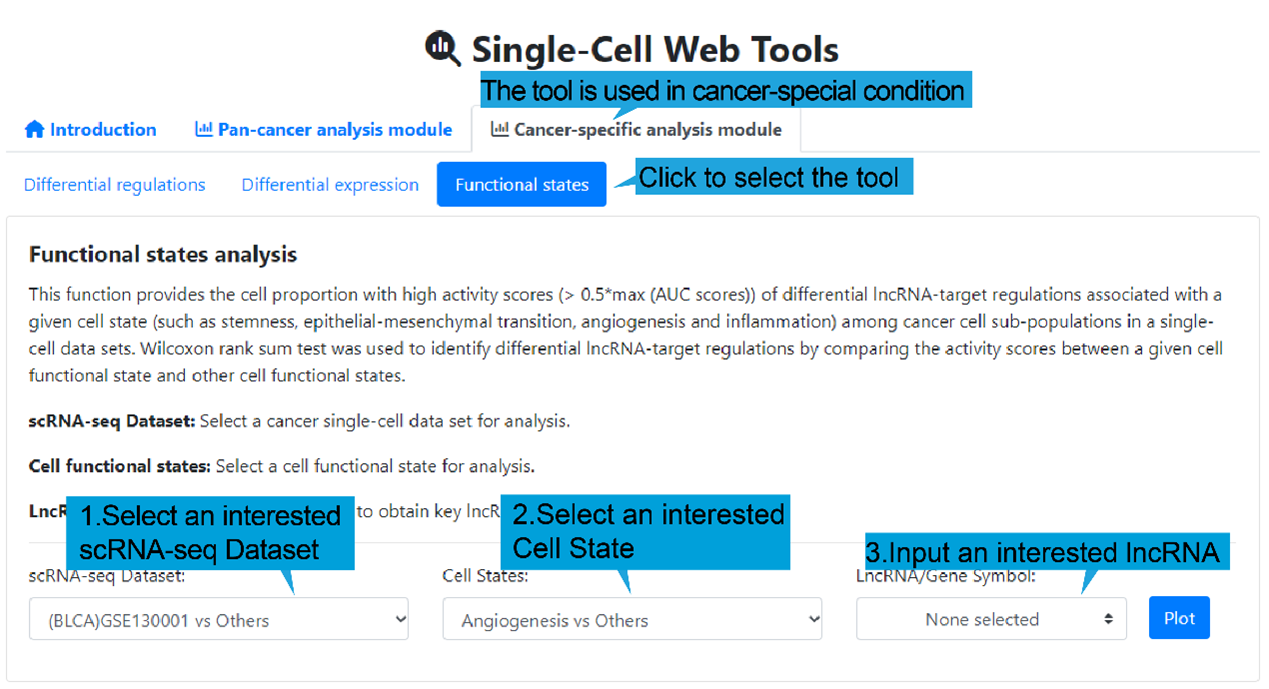
Select a cancer single-cell dataset for analysis.
Cell states: Select a cell functional state for analysis.
LncRNA/Gene Symbol: Select a lncRNA to obtain lncRNA-target regulations for
analysis. (optional)
2).Differential regulations in diverse cell status
The bubble triangle plot shows the proportion of cells with high activity scores by
differentially lncRNA-target regulation in cell state subsets associated with a given
cell state in the selected single-cell dataset. (figure below) To show the differential
lncRNA-target regulations in different cell sub-population in the selected dataset under
the selected cell state, , we used the same approach as 'Differential regulations',
including CSN, Wilcoxon rank sum test and AUCell. The results of differential expression
are shown in the table below.
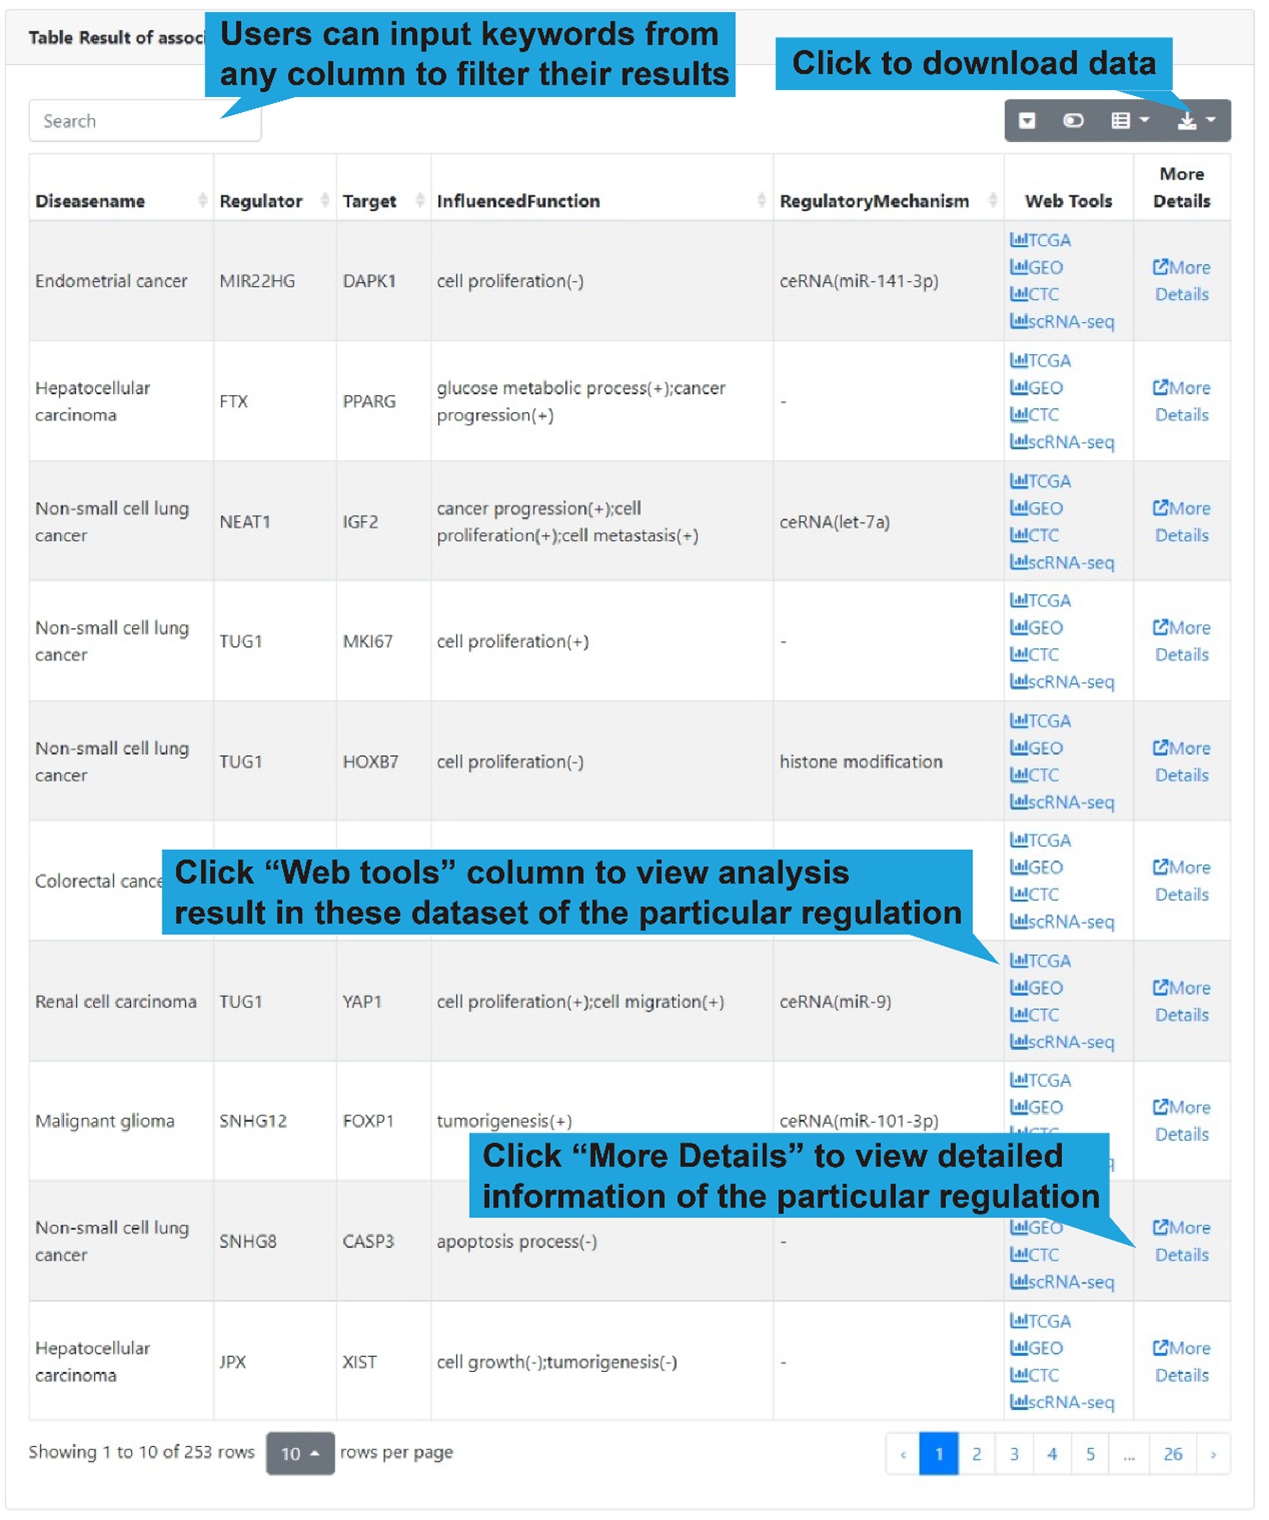
3).Search result table
The figure below shows the details of the searched lncRNA. We provided a table, with a
single association record on each line that contains disease name, lncRNA name, target
name, influenced biological functions and regulatory mechanism. Users can filter the
results using the search box in the upper left corner (step 1 in figure below) or click
“Web Tools” to get more lncRNA and target analysis tools (step 2 in figure below) or
click “More Details” to get more detailed information of the lncRNA-target regulation of
the lncRNA-target regulation (step 3 in figure below). In addition, users can click
"Network Display" to show the functional lncRNA-target network (step 4 in figure
below).